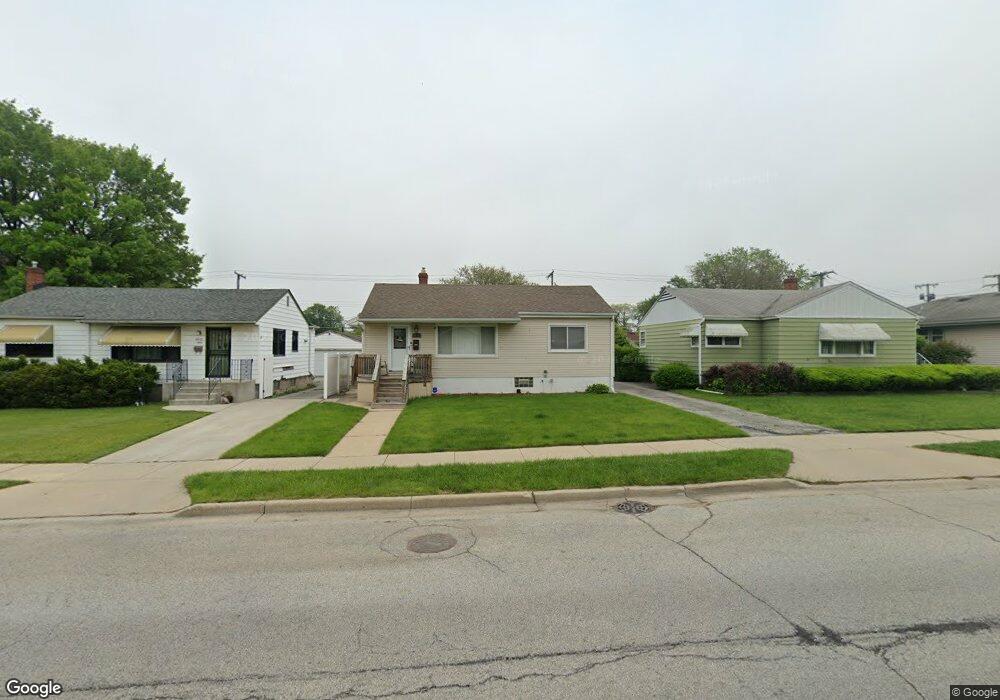
6823 Parrish Ave Hammond, IN 46323
Hessville NeighborhoodEstimated Value: $175,000 - $206,000
2
Beds
1
Bath
875
Sq Ft
$214/Sq Ft
Est. Value
About This Home
This home is located at 6823 Parrish Ave, Hammond, IN 46323 and is currently estimated at $186,829, approximately $213 per square foot. 6823 Parrish Ave is a home located in Lake County with nearby schools including Warren G Harding Elementary School, Charles N Scott Middle School, and Morton Senior High School.
Ownership History
Date
Name
Owned For
Owner Type
Purchase Details
Closed on
Aug 9, 2022
Sold by
Gallegos Irma and Nieves Irma G
Bought by
Nieves Irma G
Current Estimated Value
Home Financials for this Owner
Home Financials are based on the most recent Mortgage that was taken out on this home.
Original Mortgage
$110,000
Outstanding Balance
$104,906
Interest Rate
5.7%
Mortgage Type
New Conventional
Estimated Equity
$81,923
Purchase Details
Closed on
Sep 29, 2011
Sold by
Hammond Redevelopment Commission
Bought by
Gallegos Irma
Home Financials for this Owner
Home Financials are based on the most recent Mortgage that was taken out on this home.
Original Mortgage
$73,528
Interest Rate
4.5%
Mortgage Type
FHA
Purchase Details
Closed on
Sep 15, 2010
Sold by
Deutsche Bank National Trust Company
Bought by
Hammond Redevelopment Commission
Purchase Details
Closed on
Jul 9, 2010
Sold by
Kasperski Dorothy M
Bought by
Deutsche Bank National Trust Company
Create a Home Valuation Report for This Property
The Home Valuation Report is an in-depth analysis detailing your home's value as well as a comparison with similar homes in the area
Home Values in the Area
Average Home Value in this Area
Purchase History
| Date | Buyer | Sale Price | Title Company |
|---|---|---|---|
| Nieves Irma G | -- | None Listed On Document | |
| Gallegos Irma | -- | Meridian Title Corp | |
| Hammond Redevelopment Commission | -- | Meridian Title Corp | |
| Deutsche Bank National Trust Company | $40,000 | None Available |
Source: Public Records
Mortgage History
| Date | Status | Borrower | Loan Amount |
|---|---|---|---|
| Open | Nieves Irma G | $110,000 | |
| Previous Owner | Gallegos Irma | $73,528 |
Source: Public Records
Tax History
| Year | Tax Paid | Tax Assessment Tax Assessment Total Assessment is a certain percentage of the fair market value that is determined by local assessors to be the total taxable value of land and additions on the property. | Land | Improvement |
|---|---|---|---|---|
| 2025 | $1,797 | $162,900 | $27,600 | $135,300 |
| 2024 | $6,438 | $146,900 | $27,600 | $119,300 |
| 2023 | $1,611 | $134,700 | $27,600 | $107,100 |
| 2022 | $1,611 | $126,900 | $27,600 | $99,300 |
| 2021 | $1,339 | $107,300 | $16,300 | $91,000 |
| 2020 | $1,291 | $103,500 | $16,300 | $87,200 |
| 2019 | $1,291 | $96,500 | $16,300 | $80,200 |
| 2018 | $1,209 | $88,900 | $16,300 | $72,600 |
| 2017 | $1,282 | $86,600 | $16,300 | $70,300 |
| 2016 | $1,080 | $85,000 | $16,300 | $68,700 |
| 2014 | $673 | $71,300 | $16,300 | $55,000 |
| 2013 | $660 | $72,000 | $16,300 | $55,700 |
Source: Public Records
Map
Nearby Homes
- 6808 Carolina Ave
- 6720 Carolina Ave
- 6708 Kansas Ave
- 6642 Illinois Ave
- 6622 Parrish Ave
- 6839 Arkansas Ave
- 6849 Maryland Ave
- 3220 165th St
- 3232 165th St
- 6612 Missouri Ave
- 6923 Alabama Ave
- 3510 170th Ct
- 7133 Kentucky Ave
- 6828 Alabama Ave
- 3520 171st Place
- 3448 164th St
- 7007 Marshall Ave
- 7130 Grand Ave
- 3516 164th St
- 3521 164th St
- 6821 Parrish Ave
- 6829 Parrish Ave
- 6817 Parrish Ave
- 6833 Parrish Ave
- 6824 Idaho Ave
- 6820 Idaho Ave
- 6828 Idaho Ave
- 6813 Parrish Ave
- 6835 Parrish Ave
- 6816 Idaho Ave
- 6832 Idaho Ave
- 6848 Parrish Ave
- 6844 Parrish Ave
- 6838 Parrish Ave
- 6812 Idaho Ave
- 6836 Parrish Ave
- 6836 Idaho Ave
- 6803 Parrish Ave
- 6830 Parrish Ave
- 6808 Idaho Ave
Your Personal Tour Guide
Ask me questions while you tour the home.