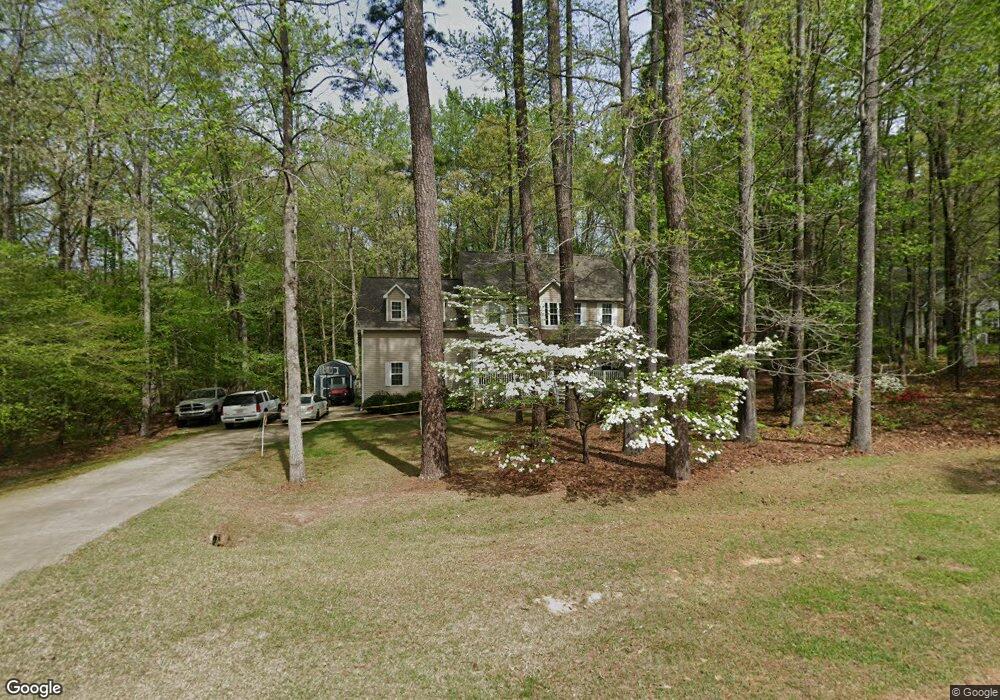
6824 Stevens Oaks Dr Garner, NC 27529
Estimated Value: $428,859 - $463,000
3
Beds
3
Baths
2,306
Sq Ft
$190/Sq Ft
Est. Value
About This Home
This home is located at 6824 Stevens Oaks Dr, Garner, NC 27529 and is currently estimated at $438,465, approximately $190 per square foot. 6824 Stevens Oaks Dr is a home located in Wake County with nearby schools including Aversboro Elementary, North Garner Middle, and South Garner High.
Ownership History
Date
Name
Owned For
Owner Type
Purchase Details
Closed on
Jul 25, 2013
Sold by
Arthur Donald and Arthur Carole
Bought by
Morris Daniel and Morris Laurie
Current Estimated Value
Home Financials for this Owner
Home Financials are based on the most recent Mortgage that was taken out on this home.
Original Mortgage
$215,000
Outstanding Balance
$158,495
Interest Rate
4.25%
Mortgage Type
Adjustable Rate Mortgage/ARM
Estimated Equity
$279,970
Purchase Details
Closed on
Jan 14, 2004
Sold by
Browning Realty Inc
Bought by
Arthur Donald and Arthur Carole
Home Financials for this Owner
Home Financials are based on the most recent Mortgage that was taken out on this home.
Original Mortgage
$132,500
Interest Rate
3.75%
Mortgage Type
Purchase Money Mortgage
Purchase Details
Closed on
Feb 7, 2003
Sold by
Ashley Turner Enterprises Inc
Bought by
Browning Realty Inc
Create a Home Valuation Report for This Property
The Home Valuation Report is an in-depth analysis detailing your home's value as well as a comparison with similar homes in the area
Home Values in the Area
Average Home Value in this Area
Purchase History
| Date | Buyer | Sale Price | Title Company |
|---|---|---|---|
| Morris Daniel | $215,000 | None Available | |
| Arthur Donald | $166,000 | Commonwealth Title Inc Co | |
| Browning Realty Inc | $25,000 | Commonwealth Land Title Ins |
Source: Public Records
Mortgage History
| Date | Status | Borrower | Loan Amount |
|---|---|---|---|
| Open | Morris Daniel | $215,000 | |
| Previous Owner | Arthur Donald | $132,500 |
Source: Public Records
Tax History Compared to Growth
Tax History
| Year | Tax Paid | Tax Assessment Tax Assessment Total Assessment is a certain percentage of the fair market value that is determined by local assessors to be the total taxable value of land and additions on the property. | Land | Improvement |
|---|---|---|---|---|
| 2025 | $2,530 | $392,477 | $90,000 | $302,477 |
| 2024 | $2,457 | $392,477 | $90,000 | $302,477 |
| 2023 | $2,148 | $272,988 | $50,000 | $222,988 |
| 2022 | $1,992 | $272,988 | $50,000 | $222,988 |
| 2021 | $1,852 | $260,736 | $50,000 | $210,736 |
| 2020 | $1,822 | $260,736 | $50,000 | $210,736 |
| 2019 | $1,705 | $206,305 | $44,000 | $162,305 |
| 2018 | $1,568 | $206,305 | $44,000 | $162,305 |
| 2017 | $1,487 | $206,305 | $44,000 | $162,305 |
| 2016 | $1,457 | $206,305 | $44,000 | $162,305 |
| 2015 | $1,433 | $203,521 | $40,000 | $163,521 |
| 2014 | $1,359 | $203,521 | $40,000 | $163,521 |
Source: Public Records
Map
Nearby Homes
- 1004 Snow Peak Ct
- 1559 Upchurch Woods Dr
- 5521 Fantasy Moth Dr
- 106 Village Ct
- 6257 Oak Passage Dr
- 6009 Swales Way
- 6408 Glen Brack Ct
- 1004 Cabin Hill Way
- 113 Hogan Dr
- 114 Boone Trail
- 171 Davelyn Ct
- 10001 Joe Leach Rd
- 15 Crest Cir
- 267 Dando St
- 35 Crosby Ln
- 170 Sallyport Ct
- 354 Dando St
- 198 Outwater Ridge Dr
- 6121 Catandpolly Ln
- 225 Marsh Creek Dr
- 6820 Stevens Oaks Dr
- 6821 Stevens Oaks Dr
- 6828 Stevens Oaks Dr
- 6825 Stevens Oaks Dr
- 6816 Stevens Oaks Dr
- 6817 Stevens Oaks Dr
- 6824 Payton View Dr
- 6841 Stevens Oaks Dr
- 6826 Payton View Dr
- 6826 Payton View Dr Unit 81
- 6812 Stevens Oaks Dr
- 6813 Stevens Oaks Dr
- 6901 Stevens Oaks Dr
- 6820 Payton View Dr Unit 83
- 6820 Payton View Dr
- 6905 Stevens Oaks Dr
- 6816 Payton View Dr
- 6816 Payton View Dr Unit 85
- 6816 Payton View Dr Unit 84
- 6816 Payton View Dr Unit 88