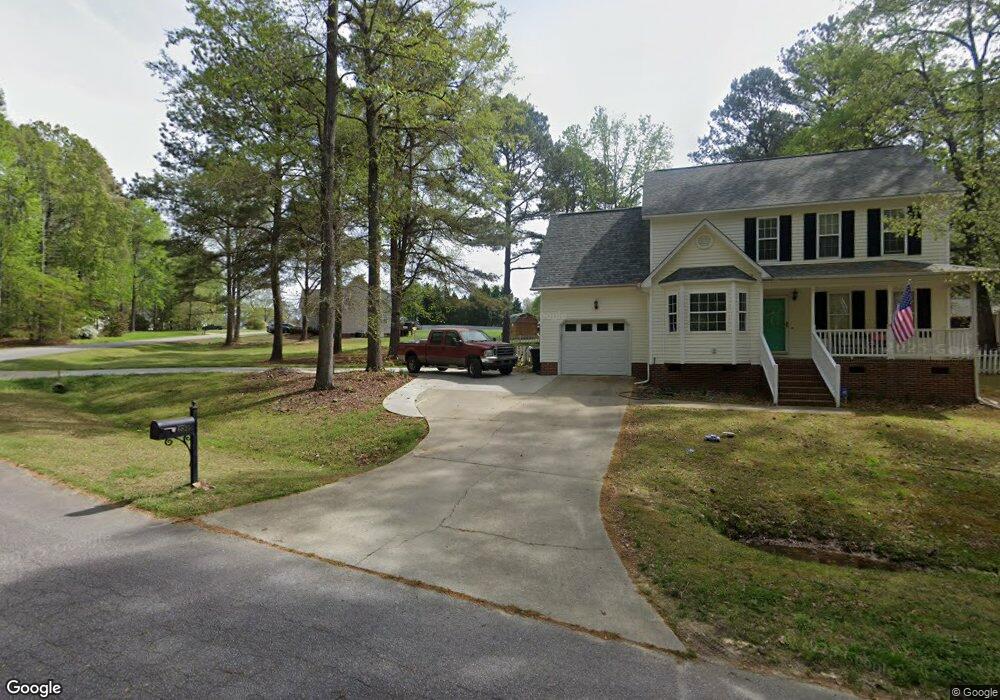
6825 Stevens Oaks Dr Garner, NC 27529
Estimated Value: $375,205 - $396,000
3
Beds
3
Baths
1,837
Sq Ft
$210/Sq Ft
Est. Value
About This Home
This home is located at 6825 Stevens Oaks Dr, Garner, NC 27529 and is currently estimated at $385,301, approximately $209 per square foot. 6825 Stevens Oaks Dr is a home located in Wake County with nearby schools including Aversboro Elementary, North Garner Middle, and South Garner High.
Ownership History
Date
Name
Owned For
Owner Type
Purchase Details
Closed on
Jul 29, 2011
Sold by
Justice Michael B and Justice Kimberly K
Bought by
Thompson Bryan A and Thompson Jennifer Vaughan
Current Estimated Value
Home Financials for this Owner
Home Financials are based on the most recent Mortgage that was taken out on this home.
Original Mortgage
$173,977
Outstanding Balance
$120,178
Interest Rate
4.52%
Mortgage Type
VA
Estimated Equity
$265,123
Purchase Details
Closed on
Jan 2, 2007
Sold by
Witmer Paul D and Witmer Jill Marie
Bought by
Justice Michael B and Justice Kimberly K
Home Financials for this Owner
Home Financials are based on the most recent Mortgage that was taken out on this home.
Original Mortgage
$140,800
Interest Rate
5.87%
Mortgage Type
Purchase Money Mortgage
Purchase Details
Closed on
Feb 22, 2001
Sold by
Allen Thornton Homes Inc
Bought by
Witmer Paul D and Witmer Jill Marie
Create a Home Valuation Report for This Property
The Home Valuation Report is an in-depth analysis detailing your home's value as well as a comparison with similar homes in the area
Home Values in the Area
Average Home Value in this Area
Purchase History
| Date | Buyer | Sale Price | Title Company |
|---|---|---|---|
| Thompson Bryan A | $170,000 | Cardinal Title Center Llc | |
| Justice Michael B | $176,000 | None Available | |
| Witmer Paul D | $157,000 | -- |
Source: Public Records
Mortgage History
| Date | Status | Borrower | Loan Amount |
|---|---|---|---|
| Open | Thompson Bryan A | $173,977 | |
| Previous Owner | Justice Michael B | $140,800 |
Source: Public Records
Tax History Compared to Growth
Tax History
| Year | Tax Paid | Tax Assessment Tax Assessment Total Assessment is a certain percentage of the fair market value that is determined by local assessors to be the total taxable value of land and additions on the property. | Land | Improvement |
|---|---|---|---|---|
| 2025 | $2,120 | $328,362 | $90,000 | $238,362 |
| 2024 | $2,059 | $328,362 | $90,000 | $238,362 |
| 2023 | $1,789 | $226,931 | $50,000 | $176,931 |
| 2022 | $1,659 | $226,931 | $50,000 | $176,931 |
| 2021 | $1,615 | $226,931 | $50,000 | $176,931 |
| 2020 | $1,588 | $226,931 | $50,000 | $176,931 |
| 2019 | $1,483 | $179,120 | $44,000 | $135,120 |
| 2018 | $1,364 | $179,120 | $44,000 | $135,120 |
| 2017 | $1,294 | $179,120 | $44,000 | $135,120 |
| 2016 | $1,268 | $179,120 | $44,000 | $135,120 |
| 2015 | $1,245 | $176,361 | $40,000 | $136,361 |
| 2014 | $1,180 | $176,361 | $40,000 | $136,361 |
Source: Public Records
Map
Nearby Homes
- 1004 Snow Peak Ct
- 1559 Upchurch Woods Dr
- 5521 Fantasy Moth Dr
- 106 Village Ct
- 6257 Oak Passage Dr
- 6408 Glen Brack Ct
- 6009 Swales Way
- 113 Hogan Dr
- 114 Boone Trail
- 171 Davelyn Ct
- 1004 Cabin Hill Way
- 15 Crest Cir
- 10001 Joe Leach Rd
- 170 Sallyport Ct
- 35 Crosby Ln
- 267 Dando St
- 354 Dando St
- 408 Johnston Rd
- 198 Outwater Ridge Dr
- 6121 Catandpolly Ln
- 6841 Stevens Oaks Dr
- 6821 Stevens Oaks Dr
- 6901 Stevens Oaks Dr
- 6824 Stevens Oaks Dr
- 917 Open Field Dr
- 0 Open Field Dr
- 917 Open Field Dr Unit 91
- 6817 Stevens Oaks Dr
- 6820 Stevens Oaks Dr
- 6905 Stevens Oaks Dr
- 6828 Stevens Oaks Dr
- 1325 Open Field Dr
- 6813 Stevens Oaks Dr
- 6816 Stevens Oaks Dr
- 1324 Open Field Dr
- 6908 Stevens Oaks Dr
- 6913 Stevens Oaks Dr
- 1321 Open Field Dr
- 6812 Stevens Oaks Dr
- 6809 Stevens Oaks Dr