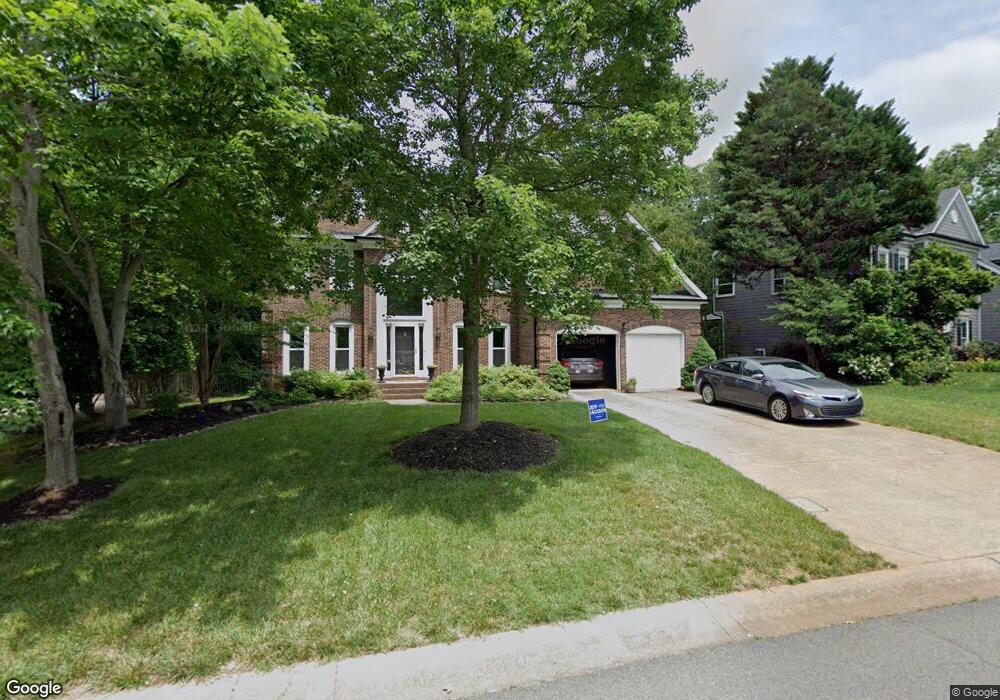
6826 Wolf Run Dr Charlotte, NC 28277
Ballantyne NeighborhoodEstimated Value: $753,964 - $813,000
4
Beds
3
Baths
2,859
Sq Ft
$273/Sq Ft
Est. Value
About This Home
This home is located at 6826 Wolf Run Dr, Charlotte, NC 28277 and is currently estimated at $781,491, approximately $273 per square foot. 6826 Wolf Run Dr is a home located in Mecklenburg County with nearby schools including Endhaven Elementary School, Jay M Robinson Middle School, and St. Matthew Catholic School.
Ownership History
Date
Name
Owned For
Owner Type
Purchase Details
Closed on
Mar 17, 2006
Sold by
Roberts Sheri L Marston and Roberts Dean S
Bought by
Hurlburt Paul E and Hurlburt Jennifer E
Current Estimated Value
Home Financials for this Owner
Home Financials are based on the most recent Mortgage that was taken out on this home.
Original Mortgage
$253,520
Outstanding Balance
$143,448
Interest Rate
6.19%
Mortgage Type
Fannie Mae Freddie Mac
Estimated Equity
$638,043
Purchase Details
Closed on
Jul 16, 2003
Sold by
Roberts Sheri L Marston and Roberts Dean S
Bought by
Roberts Dean S and Roberts Sheri L Marston
Home Financials for this Owner
Home Financials are based on the most recent Mortgage that was taken out on this home.
Original Mortgage
$201,450
Interest Rate
5.2%
Mortgage Type
Stand Alone Refi Refinance Of Original Loan
Purchase Details
Closed on
Dec 12, 2000
Sold by
Marston Thomas M
Bought by
Marston Sheri L
Create a Home Valuation Report for This Property
The Home Valuation Report is an in-depth analysis detailing your home's value as well as a comparison with similar homes in the area
Home Values in the Area
Average Home Value in this Area
Purchase History
| Date | Buyer | Sale Price | Title Company |
|---|---|---|---|
| Hurlburt Paul E | $317,000 | None Available | |
| Roberts Dean S | -- | -- | |
| Marston Sheri L | -- | -- |
Source: Public Records
Mortgage History
| Date | Status | Borrower | Loan Amount |
|---|---|---|---|
| Open | Hurlburt Paul E | $253,520 | |
| Previous Owner | Roberts Dean S | $201,450 |
Source: Public Records
Tax History Compared to Growth
Tax History
| Year | Tax Paid | Tax Assessment Tax Assessment Total Assessment is a certain percentage of the fair market value that is determined by local assessors to be the total taxable value of land and additions on the property. | Land | Improvement |
|---|---|---|---|---|
| 2025 | $4,592 | $586,100 | $120,000 | $466,100 |
| 2024 | $4,592 | $586,100 | $120,000 | $466,100 |
| 2023 | $4,438 | $586,100 | $120,000 | $466,100 |
| 2022 | $3,731 | $373,600 | $110,000 | $263,600 |
| 2021 | $3,720 | $373,600 | $110,000 | $263,600 |
| 2020 | $3,712 | $373,600 | $110,000 | $263,600 |
| 2019 | $3,697 | $373,600 | $110,000 | $263,600 |
| 2018 | $3,698 | $276,300 | $70,000 | $206,300 |
| 2017 | $3,639 | $276,300 | $70,000 | $206,300 |
| 2016 | $3,630 | $276,300 | $70,000 | $206,300 |
| 2015 | $3,618 | $276,300 | $70,000 | $206,300 |
| 2014 | $3,611 | $276,300 | $70,000 | $206,300 |
Source: Public Records
Map
Nearby Homes
- 10720 Back Ridge Rd
- 6819 Charter Hills Rd
- 6718 Charter Hills Rd
- 6721 Charter Hills Rd
- 6728 Stanette Dr
- 10940 Wild Dove Ln
- 10520 Misty Ridge Ln
- 9209 Colin Crossing Ct
- 10437 Rougemont Ln
- 3112 Endhaven Terraces Ln Unit 6
- 3108 Endhaven Terraces Ln Unit 7
- 3104 Endhaven Terraces Ln Unit 8
- 3100 Endhaven Terraces Ln Unit 9
- 4007 Hickory Springs Ln Unit 29
- 3020 Endhaven Terraces Ln Unit 10
- 4011 Hickory Springs Ln Unit 30
- 3016 Endhaven Terraces Ln Unit 11
- 4015 Hickory Springs Ln Unit 31
- 3008 Endhaven Terraces Ln Unit 13
- 4022 Hickory Springs Ln Unit 45
- 6900 Wolf Run Dr
- 6820 Wolf Run Dr
- 6910 Wolf Run Dr
- 6810 Wolf Run Dr
- 6810 Wolf Run Dr Unit 36
- 6829 Wolf Run Dr
- 6823 Wolf Run Dr
- 6901 Wolf Run Dr
- 10718 Whitfield Ridge Dr
- 6918 Wolf Run Dr
- 6800 Wolf Run Dr
- 6817 Wolf Run Dr
- 6907 Wolf Run Dr
- 10710 Whitfield Ridge Dr
- 6813R Wolf Run Dr
- 6813 Wolf Run Dr Unit 54
- 6813 Wolf Run Dr
- 6911 Wolf Run Dr
- 10704 Whitfield Ridge Dr
- 6924 Wolf Run Dr