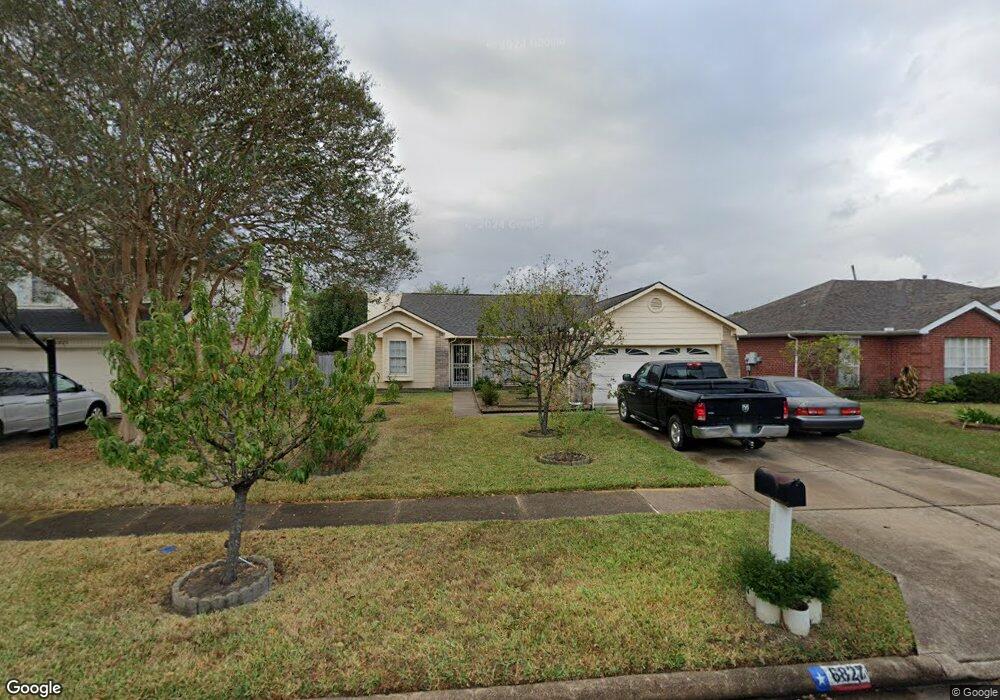
6827 Redding Springs Ln Houston, TX 77086
North Houston NeighborhoodEstimated Value: $227,186 - $250,000
3
Beds
2
Baths
1,677
Sq Ft
$142/Sq Ft
Est. Value
About This Home
This home is located at 6827 Redding Springs Ln, Houston, TX 77086 and is currently estimated at $237,297, approximately $141 per square foot. 6827 Redding Springs Ln is a home located in Harris County with nearby schools including Kujawa EC/Pre-K/K School, Carmichael Elementary School, and Shotwell Middle School.
Ownership History
Date
Name
Owned For
Owner Type
Purchase Details
Closed on
Mar 6, 2024
Sold by
Phung Su and Tran Anh Phung
Bought by
Su Phung And Anh Phung Tran Revocable Living and Phung
Current Estimated Value
Purchase Details
Closed on
Sep 13, 2009
Sold by
Phung Su
Bought by
Phung Su and Tran Anh Phung
Purchase Details
Closed on
Sep 13, 2003
Sold by
Phung Steven and Phung Stephanie Tu
Bought by
Phung Su
Purchase Details
Closed on
Aug 18, 1994
Sold by
Lange David N and Lange Cynthia Gerber
Bought by
Phung Steven and Phung Stephanie Tu
Home Financials for this Owner
Home Financials are based on the most recent Mortgage that was taken out on this home.
Original Mortgage
$48,900
Interest Rate
8.66%
Create a Home Valuation Report for This Property
The Home Valuation Report is an in-depth analysis detailing your home's value as well as a comparison with similar homes in the area
Home Values in the Area
Average Home Value in this Area
Purchase History
| Date | Buyer | Sale Price | Title Company |
|---|---|---|---|
| Su Phung And Anh Phung Tran Revocable Living | -- | None Listed On Document | |
| Phung Su | -- | None Available | |
| Phung Su | -- | -- | |
| Phung Steven | -- | Heritage Title Company |
Source: Public Records
Mortgage History
| Date | Status | Borrower | Loan Amount |
|---|---|---|---|
| Previous Owner | Phung Steven | $48,900 |
Source: Public Records
Tax History Compared to Growth
Tax History
| Year | Tax Paid | Tax Assessment Tax Assessment Total Assessment is a certain percentage of the fair market value that is determined by local assessors to be the total taxable value of land and additions on the property. | Land | Improvement |
|---|---|---|---|---|
| 2025 | $2,762 | $256,299 | $39,117 | $217,182 |
| 2024 | $2,762 | $259,980 | $39,117 | $220,863 |
| 2023 | $2,762 | $268,789 | $39,117 | $229,672 |
| 2022 | $4,580 | $188,148 | $33,150 | $154,998 |
| 2021 | $4,268 | $183,788 | $33,150 | $150,638 |
| 2020 | $4,314 | $173,363 | $33,150 | $140,213 |
| 2019 | $4,077 | $152,000 | $16,907 | $135,093 |
| 2018 | $1,027 | $152,000 | $16,907 | $135,093 |
| 2017 | $3,249 | $141,571 | $14,918 | $126,653 |
| 2016 | $2,954 | $131,612 | $14,918 | $116,694 |
| 2015 | $1,343 | $133,354 | $14,918 | $118,436 |
| 2014 | $1,343 | $100,971 | $14,918 | $86,053 |
Source: Public Records
Map
Nearby Homes
- 6830 Desert Rose Ln
- 6706 Redding Springs Ln
- 7011 Lower Arrow Dr
- 9815 Lonsford Dr
- 6822 Dusty Dawn Dr
- 6703 Deer Ridge Ln
- 6622 Sutton Meadows Dr
- 0 Tomball Pkwy
- 6606 Dusty Dawn Dr
- 6911 Silver Star Dr
- 10306 Jillana Kaye Dr
- 10214 Trade Winds Dr
- 7307 Silver Star Dr
- 10307 Bammel North Houston Rd
- 7302 Seton Lake Dr
- 10730 Antoine Dr
- 6411 Halstead Meadows Cir
- 7023 Sandswept Ln
- 7002 Sandswept Ln
- 6502 Trail Valley Way
- 6823 Redding Springs Ln
- 6831 Redding Springs Ln
- 6819 Redding Springs Ln
- 6835 Redding Springs Ln
- 6826 Redding Springs Ln
- 6815 Redding Springs Ln
- 6839 Redding Springs Ln
- 6822 Redding Springs Ln
- 6830 Redding Springs Ln
- 6818 Redding Springs Ln
- 6834 Redding Springs Ln
- 10134 Revelstoke Dr
- 10130 Revelstoke Dr
- 10138 Revelstoke Dr
- 10126 Revelstoke Dr
- 6811 Redding Springs Ln
- 6903 Redding Springs Ln
- 6814 Redding Springs Ln
- 6838 Redding Springs Ln
- 10142 Revelstoke Dr