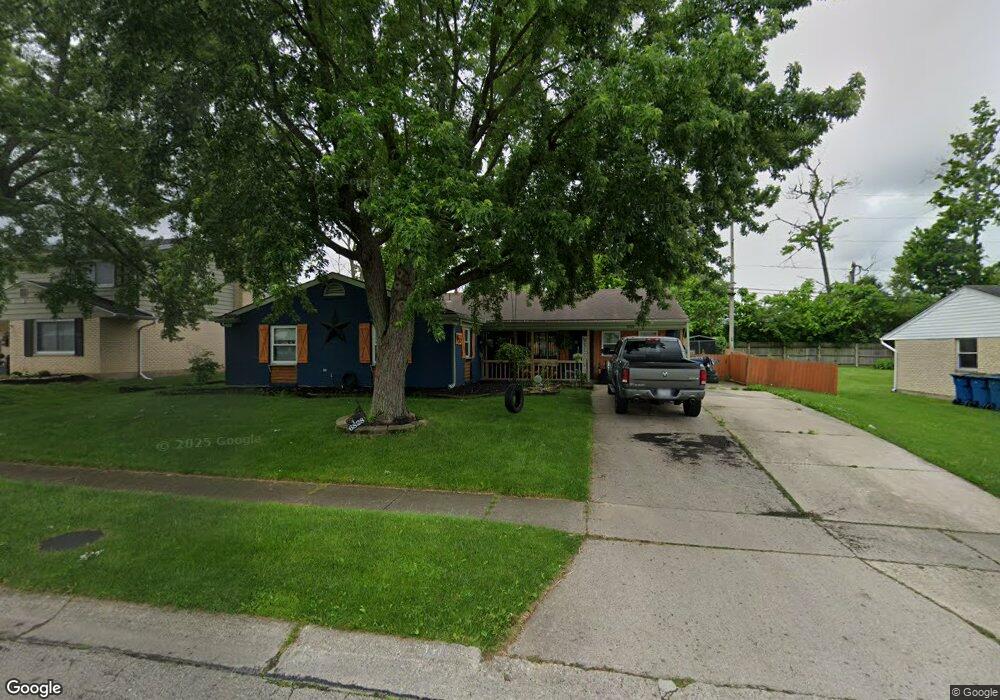
6828 Alter Rd Dayton, OH 45424
Estimated Value: $211,000 - $230,000
3
Beds
2
Baths
1,579
Sq Ft
$139/Sq Ft
Est. Value
About This Home
This home is located at 6828 Alter Rd, Dayton, OH 45424 and is currently estimated at $219,366, approximately $138 per square foot. 6828 Alter Rd is a home located in Montgomery County with nearby schools including Wayne High School and Huber Heights Christian Academy.
Ownership History
Date
Name
Owned For
Owner Type
Purchase Details
Closed on
Mar 26, 2020
Sold by
Walton Investments Corporation
Bought by
Haworth Jonathan C
Current Estimated Value
Home Financials for this Owner
Home Financials are based on the most recent Mortgage that was taken out on this home.
Original Mortgage
$150,100
Outstanding Balance
$132,970
Interest Rate
3.4%
Mortgage Type
New Conventional
Estimated Equity
$86,396
Purchase Details
Closed on
Sep 7, 2016
Sold by
Dohme Andrew B
Bought by
Walton Investments Corp
Purchase Details
Closed on
Mar 13, 2007
Sold by
Maynard David L
Bought by
Dohme Andrew B
Home Financials for this Owner
Home Financials are based on the most recent Mortgage that was taken out on this home.
Original Mortgage
$81,000
Interest Rate
6.31%
Mortgage Type
Purchase Money Mortgage
Purchase Details
Closed on
Feb 8, 2002
Sold by
Maynard David L
Bought by
Maynard Brenda J
Create a Home Valuation Report for This Property
The Home Valuation Report is an in-depth analysis detailing your home's value as well as a comparison with similar homes in the area
Home Values in the Area
Average Home Value in this Area
Purchase History
| Date | Buyer | Sale Price | Title Company |
|---|---|---|---|
| Haworth Jonathan C | $158,000 | Home Services Title Llc | |
| Walton Investments Corp | $52,100 | None Available | |
| Dohme Andrew B | $90,000 | None Available | |
| Maynard Brenda J | -- | -- |
Source: Public Records
Mortgage History
| Date | Status | Borrower | Loan Amount |
|---|---|---|---|
| Open | Haworth Jonathan C | $150,100 | |
| Previous Owner | Dohme Andrew B | $81,000 |
Source: Public Records
Tax History Compared to Growth
Tax History
| Year | Tax Paid | Tax Assessment Tax Assessment Total Assessment is a certain percentage of the fair market value that is determined by local assessors to be the total taxable value of land and additions on the property. | Land | Improvement |
|---|---|---|---|---|
| 2024 | $2,820 | $53,880 | $10,150 | $43,730 |
| 2023 | $2,820 | $53,880 | $10,150 | $43,730 |
| 2022 | $2,471 | $37,120 | $7,000 | $30,120 |
| 2021 | $2,572 | $37,120 | $7,000 | $30,120 |
| 2020 | $2,466 | $37,120 | $7,000 | $30,120 |
| 2019 | $2,424 | $31,440 | $7,000 | $24,440 |
| 2018 | $2,433 | $31,440 | $7,000 | $24,440 |
| 2017 | $2,418 | $31,440 | $7,000 | $24,440 |
| 2016 | $2,241 | $29,140 | $7,000 | $22,140 |
| 2015 | $2,213 | $29,140 | $7,000 | $22,140 |
| 2014 | $2,213 | $29,140 | $7,000 | $22,140 |
| 2012 | -- | $32,880 | $8,750 | $24,130 |
Source: Public Records
Map
Nearby Homes
- 6717 Alter Rd
- 6811 Highbury Rd
- 6946 Hubbard Dr
- 6413 Alter Rd
- 7315 Glengate Ct
- 7061 Rio Vista Ct
- 6601 Grovehill Dr
- 7222 Brandtvista Ave
- 6605 Highbury Rd
- 6245 Longford Rd
- 6800 Cicero Ct
- 6739 Evergreen Woods Dr
- 6506 Tellea St
- 6960 Serene Place
- 7126 Mandrake Dr
- 6673 Celestine St
- 7424 Chatlake Dr
- 7515 Beldale Ave
- 7011 Safari Dr
- 7611 Shepherdess Dr