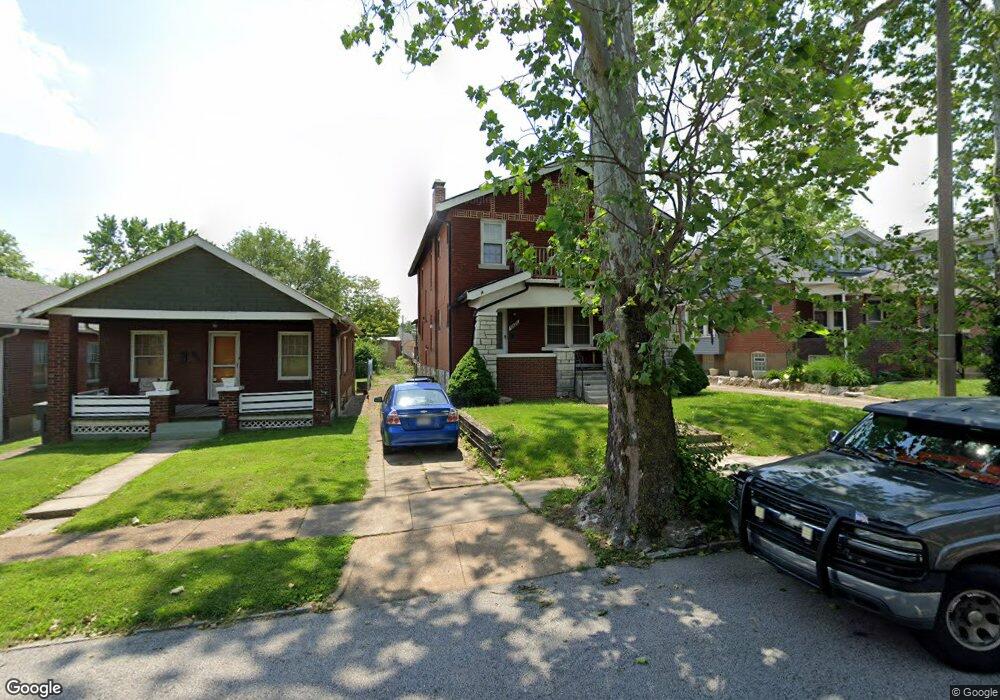
6828 Fyler Ave Saint Louis, MO 63139
Lindenwood Park NeighborhoodEstimated Value: $298,074 - $430,000
4
Beds
2
Baths
2,640
Sq Ft
$142/Sq Ft
Est. Value
About This Home
This home is located at 6828 Fyler Ave, Saint Louis, MO 63139 and is currently estimated at $375,269, approximately $142 per square foot. 6828 Fyler Ave is a home located in St. Louis City with nearby schools including Mason Elementary School, Long International Middle School, and Roosevelt High School.
Ownership History
Date
Name
Owned For
Owner Type
Purchase Details
Closed on
Feb 14, 2013
Sold by
Federal Home Loan Mortgage Corporation
Bought by
Norris Steven Cory
Current Estimated Value
Purchase Details
Closed on
Apr 20, 2012
Sold by
Hunt Alyssa R and Hunt David L
Bought by
Federal Home Loan Mortgage Corporation
Purchase Details
Closed on
Oct 18, 2002
Sold by
Hunt Pat and Hunt Melba
Bought by
Hunt Scott and Hunt Alyssa R
Home Financials for this Owner
Home Financials are based on the most recent Mortgage that was taken out on this home.
Original Mortgage
$127,991
Interest Rate
6.13%
Mortgage Type
Purchase Money Mortgage
Purchase Details
Closed on
Jul 26, 2000
Sold by
Thole Thomas A and Thole Linda K
Bought by
Hunt Pat and Hunt Melba
Home Financials for this Owner
Home Financials are based on the most recent Mortgage that was taken out on this home.
Original Mortgage
$84,000
Interest Rate
10.52%
Mortgage Type
Purchase Money Mortgage
Create a Home Valuation Report for This Property
The Home Valuation Report is an in-depth analysis detailing your home's value as well as a comparison with similar homes in the area
Home Values in the Area
Average Home Value in this Area
Purchase History
| Date | Buyer | Sale Price | Title Company |
|---|---|---|---|
| Norris Steven Cory | -- | Stewart Title | |
| Federal Home Loan Mortgage Corporation | $146,612 | None Available | |
| Hunt Scott | -- | -- | |
| Hunt Pat | -- | -- |
Source: Public Records
Mortgage History
| Date | Status | Borrower | Loan Amount |
|---|---|---|---|
| Previous Owner | Hunt Scott | $127,991 | |
| Previous Owner | Hunt Pat | $84,000 |
Source: Public Records
Tax History Compared to Growth
Tax History
| Year | Tax Paid | Tax Assessment Tax Assessment Total Assessment is a certain percentage of the fair market value that is determined by local assessors to be the total taxable value of land and additions on the property. | Land | Improvement |
|---|---|---|---|---|
| 2025 | $2,569 | $35,730 | $3,420 | $32,310 |
| 2024 | $2,444 | $30,350 | $3,420 | $26,930 |
| 2023 | $2,444 | $30,350 | $3,420 | $26,930 |
| 2022 | $2,246 | $26,830 | $3,420 | $23,410 |
| 2021 | $2,243 | $26,830 | $3,420 | $23,410 |
| 2020 | $2,084 | $25,100 | $3,420 | $21,680 |
| 2019 | $2,077 | $25,100 | $3,420 | $21,680 |
| 2018 | $1,967 | $23,030 | $3,040 | $19,990 |
| 2017 | $1,934 | $23,030 | $3,040 | $19,990 |
| 2016 | $1,732 | $20,330 | $3,040 | $17,290 |
| 2015 | $1,571 | $20,330 | $3,040 | $17,290 |
| 2014 | $1,553 | $20,330 | $3,040 | $17,290 |
| 2013 | -- | $20,100 | $3,040 | $17,060 |
Source: Public Records
Map
Nearby Homes
- 3308 Jamieson Ave
- 6953 Arthur Ave
- 6811 Marquette Ave
- 6653 Hancock Ave
- 3203 Ivanhoe Ave
- 6625 Hancock Ave
- 6656 Oleatha Ave
- 6568 Smiley Ave
- 6631 Pernod Ave
- 6611 Pernod Ave
- 6523 Fyler Ave
- 6659 Tholozan Ave
- 6621 Tholozan Ave
- 3316 Commonwealth Ave
- 6627 Arsenal St
- 3558 Wabash Ave
- 7038 Pernod Ave
- 6437 Hancock Ave
- 3282 Watson Rd
- 7047 Tholozan Ave
- 6824 Fyler Ave
- 6832 Fyler Ave
- 6820 Fyler Ave
- 6836 Fyler Ave
- 6816 Fyler Ave
- 6814 Fyler Ave
- 6846 Fyler Ave
- 6829 Arthur Ave
- 6823 Arthur Ave
- 6810 Fyler Ave
- 6833 Arthur Ave
- 6839 Fyler Ave
- 3320 Jamieson Ave
- 6817 Arthur Ave
- 6806 Fyler Ave
- 6831 Arthur Ave
- 6815 Arthur Ave
- 6815 Fyler Ave
- 6827 Fyler Ave
- 6843 Arthur Ave