6828 Hawk Ridge Dr Ferndale, WA 98248
Estimated Value: $989,000
4
Beds
3
Baths
2,630
Sq Ft
$376/Sq Ft
Est. Value
About This Home
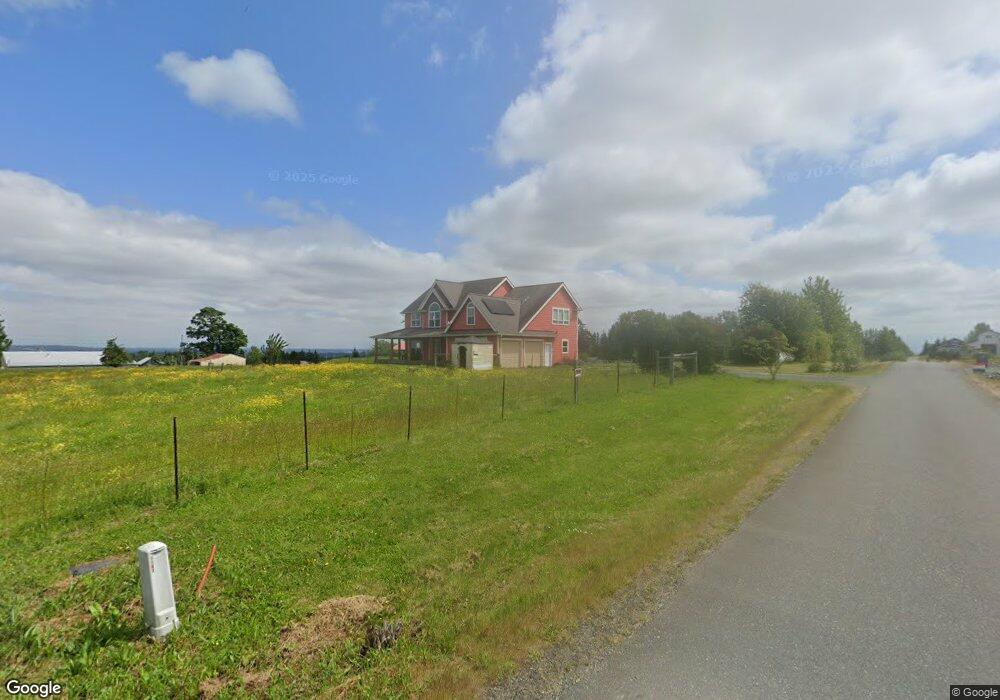
This home is located at 6828 Hawk Ridge Dr, Ferndale, WA 98248 and is currently estimated at $989,000, approximately $376 per square foot. 6828 Hawk Ridge Dr is a home located in Whatcom County with nearby schools including Custer Elementary School, Horizon Middle School, and Ferndale High School.
Ownership History
Date
Name
Owned For
Owner Type
Purchase Details
Closed on
Feb 20, 2004
Sold by
Hanson Ervin A and Hanson Elaine
Bought by
Drinkwater Ted and Drinkwater Lisa
Current Estimated Value
Home Financials for this Owner
Home Financials are based on the most recent Mortgage that was taken out on this home.
Original Mortgage
$49,500
Outstanding Balance
$21,870
Interest Rate
5%
Mortgage Type
Purchase Money Mortgage
Estimated Equity
$967,130
Purchase Details
Closed on
Dec 22, 2003
Sold by
Demeyer Dennis M and Demeyer Delores
Bought by
Hanson Ervin A and Hanson Elaine
Home Financials for this Owner
Home Financials are based on the most recent Mortgage that was taken out on this home.
Original Mortgage
$49,500
Outstanding Balance
$21,870
Interest Rate
5%
Mortgage Type
Purchase Money Mortgage
Estimated Equity
$967,130
Purchase Details
Closed on
Sep 25, 2003
Sold by
Demeyer Dennis M
Bought by
Demeyer Delores
Create a Home Valuation Report for This Property
The Home Valuation Report is an in-depth analysis detailing your home's value as well as a comparison with similar homes in the area
Home Values in the Area
Average Home Value in this Area
Purchase History
| Date | Buyer | Sale Price | Title Company |
|---|---|---|---|
| Drinkwater Ted | $85,095 | Chicago Title Insurance | |
| Hanson Ervin A | -- | -- | |
| Demeyer Delores | -- | -- |
Source: Public Records
Mortgage History
| Date | Status | Borrower | Loan Amount |
|---|---|---|---|
| Open | Drinkwater Ted | $49,500 |
Source: Public Records
Tax History Compared to Growth
Tax History
| Year | Tax Paid | Tax Assessment Tax Assessment Total Assessment is a certain percentage of the fair market value that is determined by local assessors to be the total taxable value of land and additions on the property. | Land | Improvement |
|---|---|---|---|---|
| 2024 | $6,287 | $928,156 | $343,574 | $584,582 |
| 2023 | $6,287 | $947,098 | $385,000 | $562,098 |
| 2022 | $5,273 | $940,270 | $313,088 | $627,182 |
| 2021 | $4,881 | $746,238 | $248,480 | $497,758 |
| 2020 | $4,994 | $474,472 | $52,644 | $421,828 |
| 2019 | $3,988 | $585,554 | $194,976 | $390,578 |
| 2018 | $4,691 | $400,171 | $44,400 | $355,771 |
| 2017 | $4,037 | $360,514 | $40,000 | $320,514 |
| 2016 | $4,045 | $330,664 | $36,785 | $293,879 |
| 2015 | $3,913 | $330,664 | $36,785 | $293,879 |
| 2014 | -- | $314,920 | $38,518 | $276,402 |
| 2013 | -- | $308,013 | $37,483 | $270,530 |
Source: Public Records
Map
Nearby Homes
- 6729 Hawk Ridge Dr
- 3324 Bailey Way
- 0 Grandview Rd Unit NWM2386341
- 0 Valley View Lot 2 Rd Unit NWM2208210
- 6379 Elder Rd
- 2751 Aldergrove Rd
- 6241 Olson Rd
- 0 XX Olson Rd
- 7136 Portal Way Unit 18
- 2646 Lochcarron Dr
- 3027 Main St
- 0 xxx Brown Rd
- 3883 Everett Ln
- 6152 Garrett Ln
- 2948 Arnie Rd
- 6072 Monument Dr
- 2265 Grandview Rd
- 2477 Stoneyfield Dr
- 6041 Brian Ct
- 6130 Pacific Heights Dr
- 6815 Hawk Ridge Dr
- 6833 Hawk Ridge Dr Unit A
- 6833 Hawk Ridge Dr
- 6877 Hawk Ridge Dr
- 3143 Grandview Rd
- 6 Hawkridge Dr
- 6821 Hawk Ridge Dr
- 0 Elk Rd
- 3185 Grandview Rd
- 3097 Grandview Rd
- 6763 Hawk Ridge Dr
- 0 Hawkridge Dr Unit 28163720
- 6772 Hawk Ridge Dr
- 3069 Grandview Rd
- 3211 Grandview Rd
- 3152 Grandview Rd
- 6754 Family Hill Ln
- 6750 Family Hill Ln
- 6941 Elk Rd