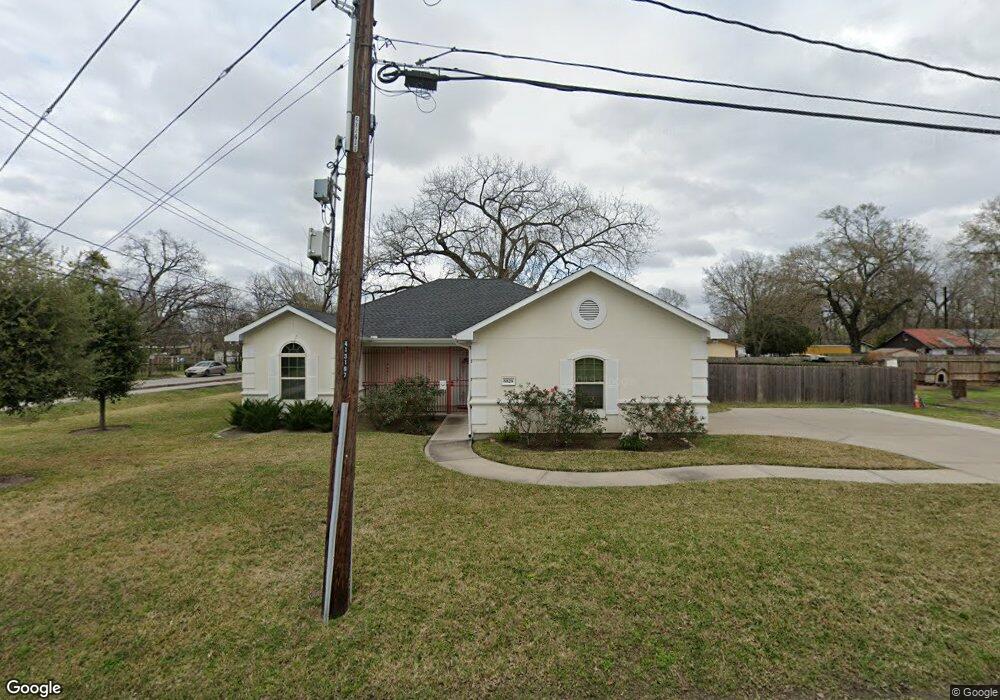
6828 Utah St Houston, TX 77091
Acres Homes NeighborhoodEstimated Value: $245,000 - $319,000
3
Beds
2
Baths
1,650
Sq Ft
$172/Sq Ft
Est. Value
About This Home
This home is located at 6828 Utah St, Houston, TX 77091 and is currently estimated at $283,557, approximately $171 per square foot. 6828 Utah St is a home located in Harris County with nearby schools including Wesley Elementary School, Williams Middle, and Booker T Washington Sr High.
Ownership History
Date
Name
Owned For
Owner Type
Purchase Details
Closed on
Jul 13, 2021
Sold by
Dunn Sammie Paul
Bought by
Clewis Dunn Jo
Current Estimated Value
Purchase Details
Closed on
Aug 29, 2014
Sold by
Mastermark Developers Inc
Bought by
Dunn Jo Clewis and Dunn Sammie P
Home Financials for this Owner
Home Financials are based on the most recent Mortgage that was taken out on this home.
Original Mortgage
$147,184
Outstanding Balance
$111,033
Interest Rate
3.75%
Mortgage Type
FHA
Estimated Equity
$172,524
Purchase Details
Closed on
Sep 27, 2013
Sold by
Land Assemblage Redevelopment Authority
Bought by
Mastermark Developers Inc
Home Financials for this Owner
Home Financials are based on the most recent Mortgage that was taken out on this home.
Original Mortgage
$110,000
Interest Rate
4.62%
Mortgage Type
New Conventional
Purchase Details
Closed on
Nov 15, 2006
Sold by
City Of Houston
Bought by
Land Assemblage Redevelopment Authority
Create a Home Valuation Report for This Property
The Home Valuation Report is an in-depth analysis detailing your home's value as well as a comparison with similar homes in the area
Home Values in the Area
Average Home Value in this Area
Purchase History
| Date | Buyer | Sale Price | Title Company |
|---|---|---|---|
| Clewis Dunn Jo | -- | None Available | |
| Dunn Jo Clewis | -- | First American Title | |
| Mastermark Developers Inc | -- | None Available | |
| Land Assemblage Redevelopment Authority | -- | None Available |
Source: Public Records
Mortgage History
| Date | Status | Borrower | Loan Amount |
|---|---|---|---|
| Open | Dunn Jo Clewis | $147,184 | |
| Previous Owner | Mastermark Developers Inc | $110,000 |
Source: Public Records
Tax History Compared to Growth
Tax History
| Year | Tax Paid | Tax Assessment Tax Assessment Total Assessment is a certain percentage of the fair market value that is determined by local assessors to be the total taxable value of land and additions on the property. | Land | Improvement |
|---|---|---|---|---|
| 2025 | $1,031 | $357,000 | $180,000 | $177,000 |
| 2024 | $1,031 | $348,858 | $180,000 | $168,858 |
| 2023 | $1,031 | $381,000 | $180,000 | $201,000 |
| 2022 | $5,794 | $319,580 | $132,000 | $187,580 |
| 2021 | $5,575 | $257,000 | $99,000 | $158,000 |
| 2020 | $5,266 | $217,468 | $60,000 | $157,468 |
| 2019 | $5,043 | $205,303 | $27,600 | $177,703 |
| 2018 | $2,552 | $0 | $0 | $0 |
| 2017 | $2,552 | $0 | $0 | $0 |
| 2016 | $2,552 | $0 | $0 | $0 |
| 2015 | $2,856 | $139,867 | $12,000 | $127,867 |
| 2014 | $2,856 | $111,101 | $12,000 | $99,101 |
Source: Public Records
Map
Nearby Homes
- 6733 Cohn St
- 6723 Cohn St
- 6718 Utah St
- 6730 Knox St Unit A
- 6727 Utah St
- 6729 Arabella St
- 6822 Tuskegee St
- 6729 Knox St
- 6710 Utah St
- 6719 Utah St
- 872 Lovers Ln
- 872 Granville Dr
- 0 Radcliffe St
- 6726 W Montgomery Rd
- 1051 W Little York Rd
- 924 W Little York Rd
- 7002 W Montgomery
- 7014 W Montgomery Rd
- 922 W Little York Rd
- 899 W Little York Rd
- 6819 Cohn St
- 6820 Utah St
- 6820 Utah St Unit B
- 6825 Cohn St
- 6825 Cohn St
- 6819 Cohn St
- 6819 Cohn St
- 928 Granville Dr
- 926 Granville Dr
- 6808 Utah St Unit B
- 6808 Utah St Unit A
- 6808 Utah St
- 6808 Utah St Unit 1
- 932 Granville Dr
- 6809 Utah St Unit A
- 6805 Cohn St
- 920 Granville Dr
- 938 Granville Dr
- 915 Granville Dr
- 916 Granville Dr