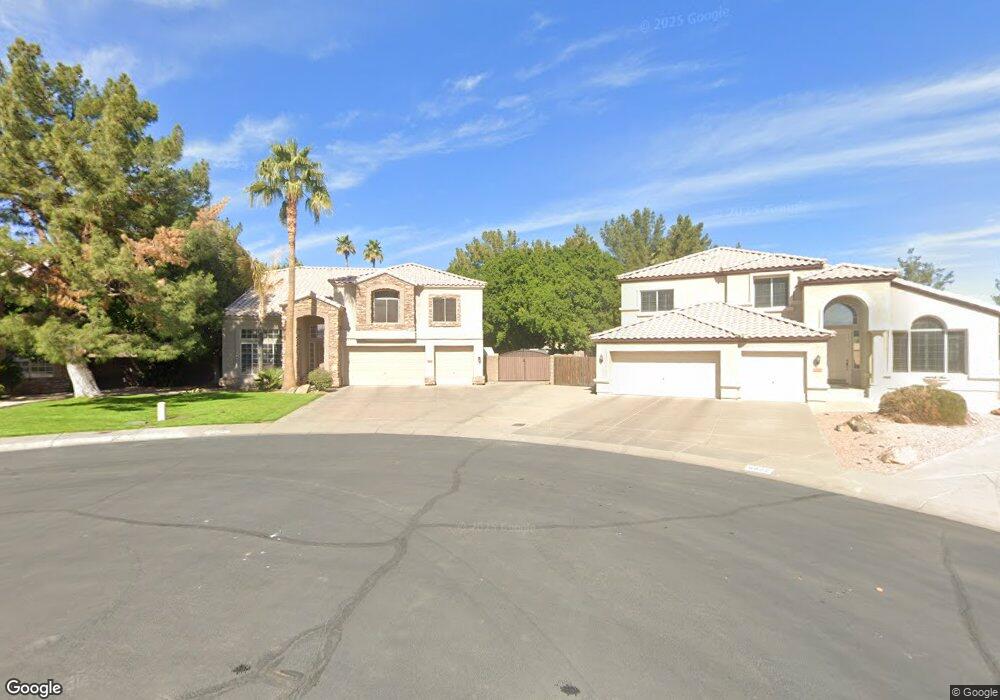
6828 W Marco Polo Rd Glendale, AZ 85308
Arrowhead NeighborhoodEstimated Value: $688,581 - $798,000
4
Beds
3
Baths
3,596
Sq Ft
$207/Sq Ft
Est. Value
About This Home
This home is located at 6828 W Marco Polo Rd, Glendale, AZ 85308 and is currently estimated at $745,645, approximately $207 per square foot. 6828 W Marco Polo Rd is a home located in Maricopa County with nearby schools including Highland Lakes School, Arrowhead Elementary School, and Deer Valley High School.
Ownership History
Date
Name
Owned For
Owner Type
Purchase Details
Closed on
Jun 19, 2014
Sold by
Davenport Drew and Davenport Drew M
Bought by
Davenport Drew M
Current Estimated Value
Home Financials for this Owner
Home Financials are based on the most recent Mortgage that was taken out on this home.
Original Mortgage
$320,000
Outstanding Balance
$229,458
Interest Rate
2.75%
Mortgage Type
Adjustable Rate Mortgage/ARM
Estimated Equity
$516,187
Purchase Details
Closed on
Mar 2, 2010
Sold by
Sound Homes Llc
Bought by
Davenport Drew
Home Financials for this Owner
Home Financials are based on the most recent Mortgage that was taken out on this home.
Original Mortgage
$342,500
Interest Rate
4.87%
Mortgage Type
New Conventional
Purchase Details
Closed on
Oct 19, 2009
Sold by
Storm Michael William
Bought by
Sound Homes Llc
Purchase Details
Closed on
Oct 5, 1995
Sold by
U S Home Corp
Bought by
Storm Michael William
Create a Home Valuation Report for This Property
The Home Valuation Report is an in-depth analysis detailing your home's value as well as a comparison with similar homes in the area
Home Values in the Area
Average Home Value in this Area
Purchase History
| Date | Buyer | Sale Price | Title Company |
|---|---|---|---|
| Davenport Drew M | -- | Stewart Title & Trust | |
| Davenport Drew | $342,500 | Magnus Title Agency | |
| Sound Homes Llc | $207,001 | Accommodation | |
| Storm Michael William | $198,613 | Stewart Title & Trust |
Source: Public Records
Mortgage History
| Date | Status | Borrower | Loan Amount |
|---|---|---|---|
| Open | Davenport Drew M | $320,000 | |
| Closed | Davenport Drew | $342,500 |
Source: Public Records
Tax History Compared to Growth
Tax History
| Year | Tax Paid | Tax Assessment Tax Assessment Total Assessment is a certain percentage of the fair market value that is determined by local assessors to be the total taxable value of land and additions on the property. | Land | Improvement |
|---|---|---|---|---|
| 2025 | $3,589 | $43,798 | -- | -- |
| 2024 | $3,550 | $41,713 | -- | -- |
| 2023 | $3,550 | $53,180 | $10,630 | $42,550 |
| 2022 | $3,449 | $40,820 | $8,160 | $32,660 |
| 2021 | $3,587 | $38,360 | $7,670 | $30,690 |
| 2020 | $3,546 | $36,380 | $7,270 | $29,110 |
| 2019 | $3,458 | $33,220 | $6,640 | $26,580 |
| 2018 | $3,372 | $32,650 | $6,530 | $26,120 |
| 2017 | $3,281 | $32,350 | $6,470 | $25,880 |
| 2016 | $3,113 | $31,630 | $6,320 | $25,310 |
| 2015 | $2,885 | $31,260 | $6,250 | $25,010 |
Source: Public Records
Map
Nearby Homes
- 6750 W Behrend Dr
- 6914 W Escuda Dr
- 6749 W Oraibi Dr
- 6722 W Piute Ave
- 6925 W Tonto Dr
- 7101 W Beardsley Rd Unit 1104
- 7101 W Beardsley Rd Unit 1403
- 7101 W Beardsley Rd Unit 452
- 6904 W Kristal Way
- 6971 W Irma Ln
- 6962 W Irma Ln
- 6858 W Potter Dr
- 19222 N 70th Ave
- 6987 W Potter Dr
- 7021 W Irma Ln
- 6415 W Escuda Rd
- 7177 W Pontiac Dr
- 6382 W Blackhawk Dr
- 6351 W Pontiac Dr
- 19976 N 63rd Dr
- 6822 W Marco Polo Rd
- 6823 W Marco Polo Rd
- 19847 N 68th Dr
- 19853 N 68th Dr
- 6829 W Escuda Rd
- 6835 W Escuda Rd
- 19841 N 68th Dr
- 6816 W Marco Polo Rd
- 6817 W Marco Polo Rd
- 19835 N 68th Dr
- 6841 W Escuda Rd
- 6810 W Marco Polo Rd
- 6811 W Marco Polo Rd
- 6834 W Escuda Rd
- 19829 N 68th Dr
- 6756 W Wahalla Ln
- 19818 N 68th Ave
- 19852 N 68th Dr
- 19846 N 68th Dr
- 19858 N 68th Dr