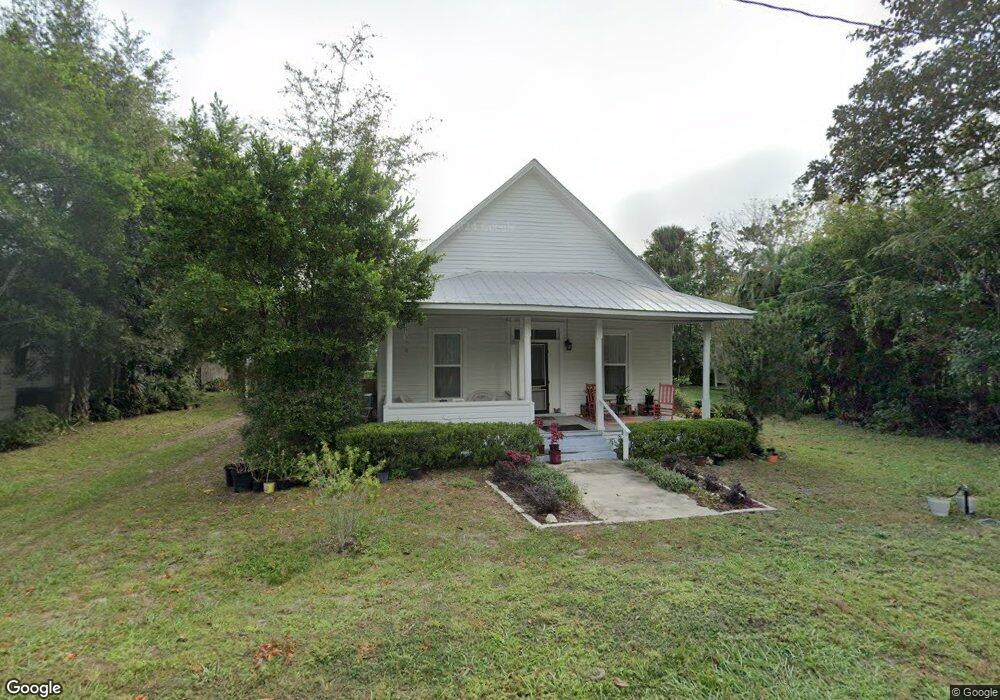
6829 SE 220th Terrace Hawthorne, FL 32640
Estimated Value: $184,269 - $249,000
3
Beds
1
Bath
1,692
Sq Ft
$128/Sq Ft
Est. Value
About This Home
This home is located at 6829 SE 220th Terrace, Hawthorne, FL 32640 and is currently estimated at $216,567, approximately $127 per square foot. 6829 SE 220th Terrace is a home located in Alachua County with nearby schools including Chester Shell Elementary School and Hawthorne Middle/High School.
Ownership History
Date
Name
Owned For
Owner Type
Purchase Details
Closed on
Apr 20, 2021
Sold by
Story Joyce A
Bought by
Story Joyce A and Joyce A Story Revocable Trust
Current Estimated Value
Purchase Details
Closed on
Oct 5, 2020
Sold by
Lewis Phillip David and Lewis David
Bought by
Story Joyce A and Jocy A Story Revocable Trust
Purchase Details
Closed on
Dec 27, 2013
Sold by
Lewis Philip David and Story Charles H
Bought by
Story Joyce Ann and Joyce A Story Revocable Trust
Purchase Details
Closed on
Dec 19, 2012
Bought by
O'Hara & Story & Story Trustee
Purchase Details
Closed on
Dec 10, 2010
Bought by
O'Hara & Story & Story Trustee
Purchase Details
Closed on
Sep 10, 2010
Bought by
O'Hara & Story & Story Trustee
Purchase Details
Closed on
Feb 28, 2005
Bought by
O'Hara & Story & Story Trustee
Purchase Details
Closed on
Dec 25, 2003
Sold by
Ohara Story Ovida Ohara and Ohara Kea Grace
Bought by
Ohara William Howard
Create a Home Valuation Report for This Property
The Home Valuation Report is an in-depth analysis detailing your home's value as well as a comparison with similar homes in the area
Home Values in the Area
Average Home Value in this Area
Purchase History
| Date | Buyer | Sale Price | Title Company |
|---|---|---|---|
| Story Joyce A | -- | Accommodation | |
| Story Joyce A | -- | Attorney | |
| Story Joyce Ann | $19,500 | Attorney | |
| O'Hara & Story & Story Trustee | -- | -- | |
| O'Hara & Story & Story Trustee | $100 | -- | |
| Kea Grace Ohara | -- | None Available | |
| Story Joyce Ann | -- | None Available | |
| O'Hara & Story & Story Trustee | $100 | -- | |
| O'Hara & Story & Story Trustee | $100 | -- | |
| Ohara William Howard | -- | -- |
Source: Public Records
Tax History Compared to Growth
Tax History
| Year | Tax Paid | Tax Assessment Tax Assessment Total Assessment is a certain percentage of the fair market value that is determined by local assessors to be the total taxable value of land and additions on the property. | Land | Improvement |
|---|---|---|---|---|
| 2024 | $1,183 | $80,432 | -- | -- |
| 2023 | $1,183 | $78,090 | $0 | $0 |
| 2022 | $1,113 | $75,816 | $0 | $0 |
| 2021 | $1,033 | $73,607 | $0 | $0 |
| 2020 | $991 | $72,591 | $10,000 | $62,591 |
| 2019 | $1,451 | $71,599 | $10,000 | $61,599 |
| 2018 | $1,426 | $48,500 | $5,000 | $43,500 |
| 2017 | $1,454 | $48,500 | $5,000 | $43,500 |
| 2016 | $1,281 | $45,000 | $0 | $0 |
| 2015 | $1,288 | $45,000 | $0 | $0 |
| 2014 | $1,279 | $44,600 | $0 | $0 |
| 2013 | -- | $44,600 | $5,000 | $39,600 |
Source: Public Records
Map
Nearby Homes
- 21927 SE 69th Ave
- 7015 SE 221st St
- 0 SE 69th Ave
- 21715 SE 69th Ave
- 238 Alabama Ave
- 00 SE US Hwy 301
- 000 SE 246th Terrace
- 21514 SE 69th Ave
- 21524 SE 65th Ave
- 000 State Rd
- 0 SE Hawthorne Rd
- 21445 SE 64th Ave
- 22816 SE 64th Ave
- 7423 SE 226th Terrace
- 10503 SE Us Highway 301
- 13575 SE Us Highway 301
- 21433 SE Hawthorne Rd
- 6004 U S 301
- 22644 SE Hawthorne Rd
- 338 Portland St
- 6830 SE 221st St
- 6880 SE 221st St
- 6880 SE 221 St
- 6840 SE 221st St Unit 3
- 6834 SE 221st St Unit 2
- 6834 SE 221st St
- 6832 SE 220th Terrace
- 6810 SE 221st St
- 6832 SE 220 Terrace
- 22025 SE 69th Ave Unit C/D
- 22025 SE 69th Ave Unit E
- 22025 SE 69th Ave
- 6814 SE 220 Terrace
- 6910 SE 221st St
- 6750 SE 221st St
- 6875 SE 221st St
- 22003 SE 69th Ave
- 6736 SE 220th Terrace
- 6817 SE 219th Terrace
- 301 and 303 Rainbow Dr Hawthorne