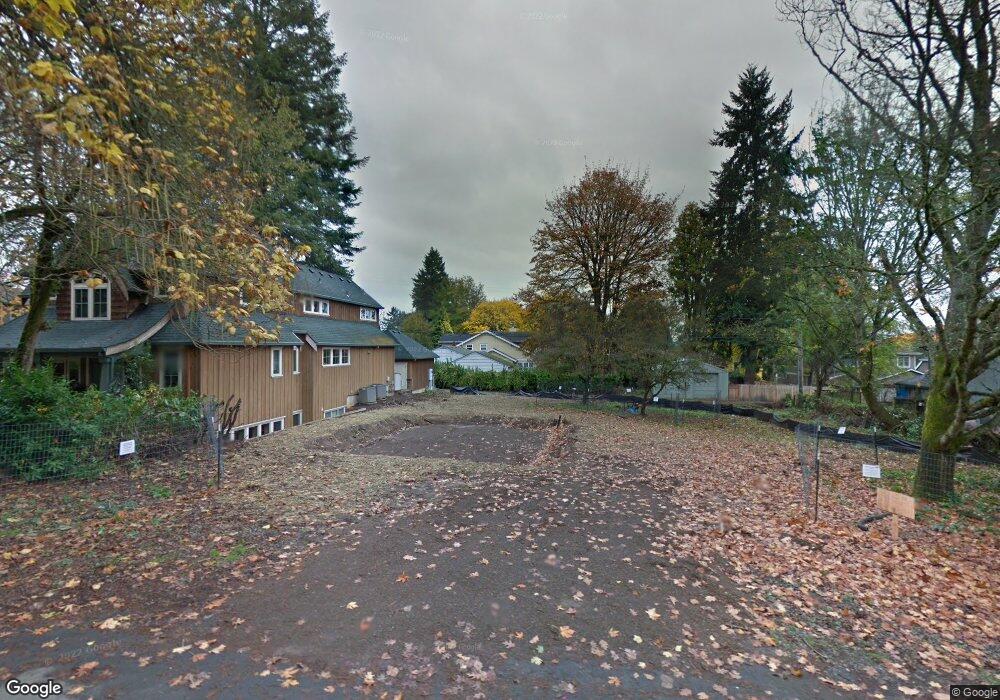
683 5th St Lake Oswego, OR 97034
Evergreen NeighborhoodEstimated Value: $1,885,933 - $2,178,000
4
Beds
3
Baths
2,811
Sq Ft
$706/Sq Ft
Est. Value
About This Home
This home is located at 683 5th St, Lake Oswego, OR 97034 and is currently estimated at $1,985,733, approximately $706 per square foot. 683 5th St is a home located in Clackamas County with nearby schools including Forest Hills Elementary School, Lake Oswego Junior High School, and Lake Oswego Senior High School.
Ownership History
Date
Name
Owned For
Owner Type
Purchase Details
Closed on
Oct 25, 2016
Sold by
Horizon Northwest Inc
Bought by
Wilkinson Denise M
Current Estimated Value
Home Financials for this Owner
Home Financials are based on the most recent Mortgage that was taken out on this home.
Original Mortgage
$815,000
Outstanding Balance
$652,451
Interest Rate
3.5%
Mortgage Type
New Conventional
Estimated Equity
$1,333,282
Purchase Details
Closed on
May 28, 2015
Sold by
Ghiorso John and Ghiorso Donna
Bought by
Horizon Northwest Inc
Home Financials for this Owner
Home Financials are based on the most recent Mortgage that was taken out on this home.
Original Mortgage
$337,500
Interest Rate
3.64%
Mortgage Type
Credit Line Revolving
Create a Home Valuation Report for This Property
The Home Valuation Report is an in-depth analysis detailing your home's value as well as a comparison with similar homes in the area
Home Values in the Area
Average Home Value in this Area
Purchase History
| Date | Buyer | Sale Price | Title Company |
|---|---|---|---|
| Wilkinson Denise M | $1,180,000 | Wfg Title | |
| Horizon Northwest Inc | $450,000 | Wfg Title |
Source: Public Records
Mortgage History
| Date | Status | Borrower | Loan Amount |
|---|---|---|---|
| Open | Wilkinson Denise M | $815,000 | |
| Previous Owner | Horizon Northwest Inc | $337,500 |
Source: Public Records
Tax History Compared to Growth
Tax History
| Year | Tax Paid | Tax Assessment Tax Assessment Total Assessment is a certain percentage of the fair market value that is determined by local assessors to be the total taxable value of land and additions on the property. | Land | Improvement |
|---|---|---|---|---|
| 2025 | $18,204 | $950,009 | -- | -- |
| 2024 | $17,719 | $922,339 | -- | -- |
| 2023 | $17,719 | $895,475 | $0 | $0 |
| 2022 | $16,688 | $869,394 | $0 | $0 |
| 2021 | $15,412 | $844,072 | $0 | $0 |
| 2020 | $15,025 | $819,488 | $0 | $0 |
| 2019 | $14,655 | $795,620 | $0 | $0 |
| 2018 | $13,936 | $772,447 | $0 | $0 |
| 2017 | $13,447 | $749,949 | $0 | $0 |
| 2016 | $1,842 | $109,550 | $0 | $0 |
| 2015 | $2,848 | $170,230 | $0 | $0 |
| 2014 | -- | $247,297 | $0 | $0 |
Source: Public Records
Map
Nearby Homes