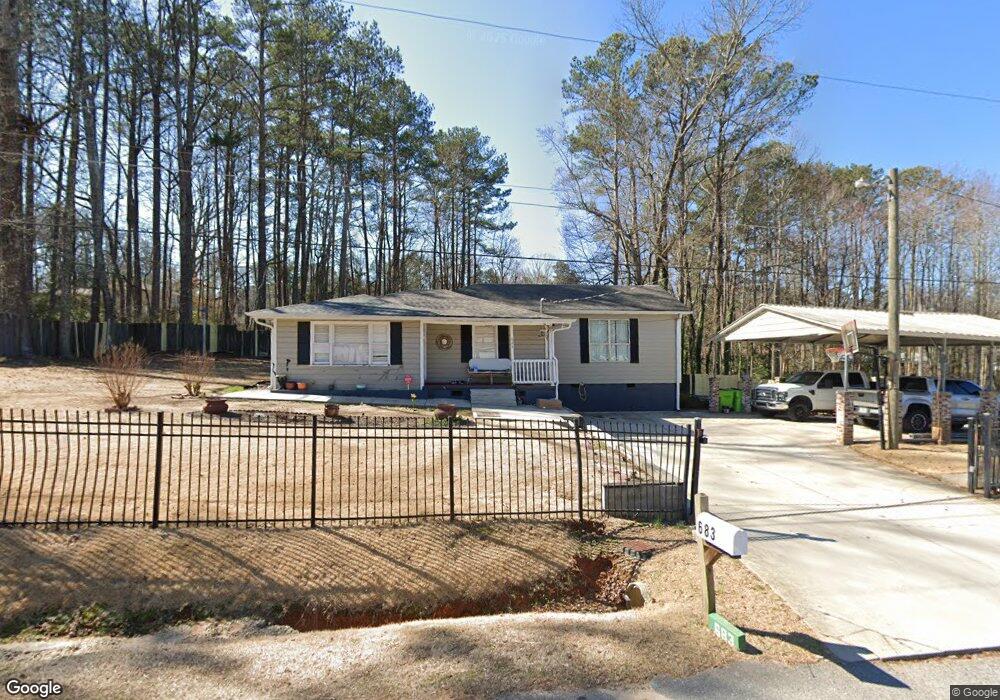
683 Britt Rd SW Mableton, GA 30126
Estimated Value: $210,000 - $316,000
2
Beds
1
Bath
985
Sq Ft
$260/Sq Ft
Est. Value
About This Home
This home is located at 683 Britt Rd SW, Mableton, GA 30126 and is currently estimated at $255,666, approximately $259 per square foot. 683 Britt Rd SW is a home located in Cobb County with nearby schools including Bryant Elementary School, Lindley Middle School, and Pebblebrook High School.
Ownership History
Date
Name
Owned For
Owner Type
Purchase Details
Closed on
Apr 5, 2013
Sold by
Flores Esmeralda
Bought by
Mejia-Rivas Jose R and Perez Alba Alicia
Current Estimated Value
Purchase Details
Closed on
Sep 7, 2010
Sold by
Banco Popular North America
Bought by
Flores Esmeralda
Purchase Details
Closed on
Jun 1, 2010
Sold by
Ayala Eva F
Bought by
Banco Popular North America
Purchase Details
Closed on
Dec 7, 2005
Sold by
Brown Jack D
Bought by
Ayala Eva F
Home Financials for this Owner
Home Financials are based on the most recent Mortgage that was taken out on this home.
Original Mortgage
$78,850
Interest Rate
8.75%
Mortgage Type
Stand Alone Second
Purchase Details
Closed on
Nov 30, 2005
Sold by
Bryan Ellen J
Bought by
Harris Frank W
Home Financials for this Owner
Home Financials are based on the most recent Mortgage that was taken out on this home.
Original Mortgage
$78,850
Interest Rate
8.75%
Mortgage Type
Stand Alone Second
Purchase Details
Closed on
Feb 19, 1997
Sold by
Mullenix Virginia
Bought by
Bryan Ellen J
Create a Home Valuation Report for This Property
The Home Valuation Report is an in-depth analysis detailing your home's value as well as a comparison with similar homes in the area
Home Values in the Area
Average Home Value in this Area
Purchase History
| Date | Buyer | Sale Price | Title Company |
|---|---|---|---|
| Mejia-Rivas Jose R | $40,000 | -- | |
| Flores Esmeralda | $18,000 | -- | |
| Banco Popular North America | -- | -- | |
| Ayala Eva F | $83,000 | -- | |
| Harris Frank W | -- | -- | |
| Bryan Ellen J | $15,000 | -- |
Source: Public Records
Mortgage History
| Date | Status | Borrower | Loan Amount |
|---|---|---|---|
| Previous Owner | Ayala Eva F | $78,850 | |
| Closed | Bryan Ellen J | $0 |
Source: Public Records
Tax History Compared to Growth
Tax History
| Year | Tax Paid | Tax Assessment Tax Assessment Total Assessment is a certain percentage of the fair market value that is determined by local assessors to be the total taxable value of land and additions on the property. | Land | Improvement |
|---|---|---|---|---|
| 2025 | $2,753 | $91,380 | $31,920 | $59,460 |
| 2024 | $2,755 | $91,380 | $31,920 | $59,460 |
| 2023 | $2,428 | $80,528 | $31,920 | $48,608 |
| 2022 | $1,788 | $58,920 | $20,160 | $38,760 |
| 2021 | $1,528 | $50,344 | $17,472 | $32,872 |
| 2020 | $1,406 | $46,312 | $13,440 | $32,872 |
| 2019 | $1,406 | $46,312 | $13,440 | $32,872 |
| 2018 | $1,151 | $37,928 | $7,728 | $30,200 |
| 2017 | $796 | $27,688 | $5,040 | $22,648 |
| 2016 | $796 | $27,688 | $5,040 | $22,648 |
| 2015 | $811 | $27,520 | $3,360 | $24,160 |
| 2014 | $475 | $15,984 | $0 | $0 |
Source: Public Records
Map
Nearby Homes
- 760 W Starling Dr SW
- 377 Waterbluff Dr SW
- 373 Waterbluff Dr SW
- 369 Waterbluff Dr SW
- 368 Waterbluff Dr SW
- 365 Waterbluff Dr SW
- 364 Waterbluff Dr SW
- 767 Kenneth Ln SW
- 6281 Denny Ln SW
- 846 Orris Ln SW
- 537 Elizabeth Ln SW
- 6365 Susan Dr SW
- 6650 Valley Hill Dr SW
- 496 Elizabeth Ln SW
- 361 Gordon Valley Ln SW
- 6649 Valley Hill Dr SW
- 6266 Britt Rd SW
- 760 Wade Farm Dr
- 6511 Gordon Hills Dr SW
- 1086 S Gordon Rd
- 705 Britt Rd SW
- 645 Britt Rd SW
- 648 Britt Rd SW
- 716 Britt Rd SW
- 712 Britt Rd SW
- 720 Britt Rd SW
- 708 Britt Rd SW
- 850 Howard Ct SW
- 840 Howard Ct SW
- 860 Howard Ct SW
- 830 Howard Ct SW
- 727 Britt Rd SW
- 649 Britt Rd SW
- 870 Howard Ct SW
- 820 Howard Ct SW
- 6370 Susan Place SW Unit 2
- 6371 Susan Place SW
- 880 Howard Ct SW
- 859 Howard Ct SW
- 849 Howard Ct SW