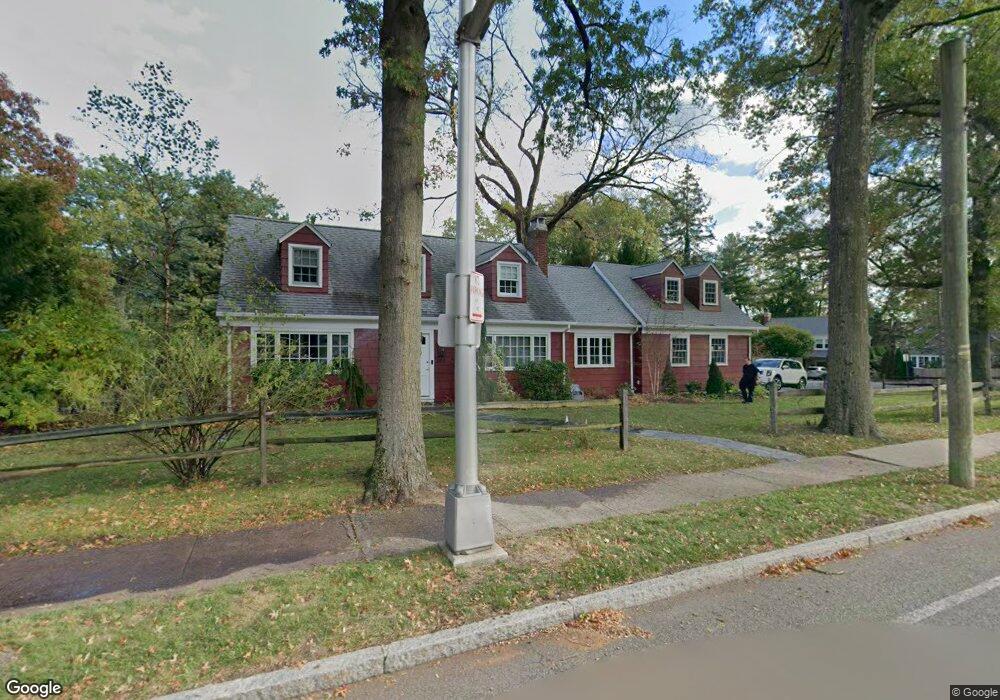
683 Grove St Montclair, NJ 07043
Estimated Value: $844,000 - $1,008,000
--
Bed
--
Bath
1,560
Sq Ft
$597/Sq Ft
Est. Value
About This Home
This home is located at 683 Grove St, Montclair, NJ 07043 and is currently estimated at $931,506, approximately $597 per square foot. 683 Grove St is a home located in Essex County with nearby schools including Bradford School, Hillside School, and Northeast Elementary School.
Ownership History
Date
Name
Owned For
Owner Type
Purchase Details
Closed on
Jul 25, 1996
Sold by
Geiger Alberta
Bought by
Gonzalez Craig and Gonzalez Paulette
Current Estimated Value
Home Financials for this Owner
Home Financials are based on the most recent Mortgage that was taken out on this home.
Original Mortgage
$114,000
Outstanding Balance
$8,908
Interest Rate
8.08%
Mortgage Type
FHA
Estimated Equity
$922,598
Create a Home Valuation Report for This Property
The Home Valuation Report is an in-depth analysis detailing your home's value as well as a comparison with similar homes in the area
Home Values in the Area
Average Home Value in this Area
Purchase History
| Date | Buyer | Sale Price | Title Company |
|---|---|---|---|
| Gonzalez Craig | $115,000 | -- |
Source: Public Records
Mortgage History
| Date | Status | Borrower | Loan Amount |
|---|---|---|---|
| Open | Gonzalez Craig | $114,000 |
Source: Public Records
Tax History Compared to Growth
Tax History
| Year | Tax Paid | Tax Assessment Tax Assessment Total Assessment is a certain percentage of the fair market value that is determined by local assessors to be the total taxable value of land and additions on the property. | Land | Improvement |
|---|---|---|---|---|
| 2025 | $15,575 | $502,500 | $246,000 | $256,500 |
| 2024 | $15,575 | $460,800 | $246,000 | $214,800 |
| 2022 | $15,151 | $460,800 | $246,000 | $214,800 |
| 2021 | $14,888 | $460,800 | $246,000 | $214,800 |
| 2020 | $14,649 | $460,800 | $246,000 | $214,800 |
| 2019 | $14,497 | $460,800 | $246,000 | $214,800 |
| 2018 | $14,257 | $460,800 | $246,000 | $214,800 |
| 2017 | $15,978 | $427,900 | $256,500 | $171,400 |
| 2016 | $15,550 | $427,900 | $256,500 | $171,400 |
| 2015 | $15,088 | $427,900 | $256,500 | $171,400 |
| 2014 | $14,583 | $427,900 | $256,500 | $171,400 |
Source: Public Records
Map
Nearby Homes
- 123 Alexander Ave
- 7 Nassau Rd
- 34 Carline Dr
- 1283 Valley Rd Unit 7
- 8350 Blvd E Unit 3A
- 1243 Valley Rd
- 6 Earnshaw Place
- 70 Anderson Dr
- 24 Malcolm Ct
- 40 Greenview Way
- 118 Country Ln
- 6 Fernwood Place
- 109 Churchill Dr
- 15 Carol Place
- 15 Twain St
- 1552 Broad St Rear
- 36 Independence Ct
- 605 Grove St Unit 4
- 605 Grove St Unit 11
- 77 Huemmer Terrace