Estimated Value: $315,000 - $335,187
4
Beds
3
Baths
2,184
Sq Ft
$147/Sq Ft
Est. Value
About This Home
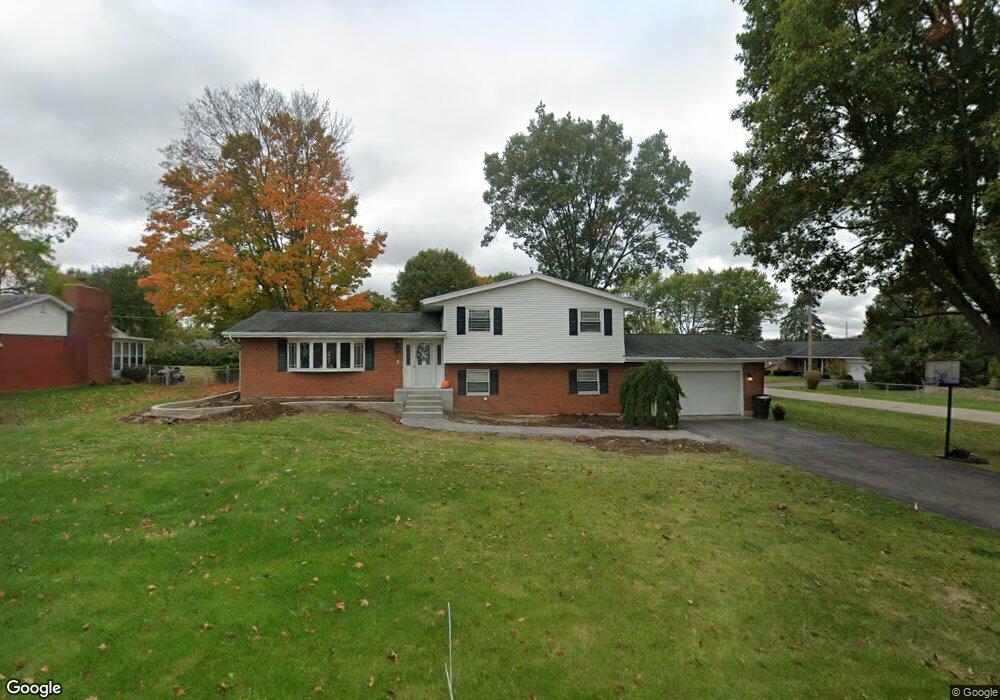
This home is located at 683 Kinsey Rd, Xenia, OH 45385 and is currently estimated at $321,797, approximately $147 per square foot. 683 Kinsey Rd is a home located in Greene County with nearby schools including Xenia High School.
Ownership History
Date
Name
Owned For
Owner Type
Purchase Details
Closed on
Dec 15, 2015
Bought by
Jones Jared K
Current Estimated Value
Home Financials for this Owner
Home Financials are based on the most recent Mortgage that was taken out on this home.
Interest Rate
3.95%
Purchase Details
Closed on
Jul 3, 2008
Sold by
Fishman Patricia A
Bought by
Jones David W and Jones Melissa G
Home Financials for this Owner
Home Financials are based on the most recent Mortgage that was taken out on this home.
Original Mortgage
$147,073
Interest Rate
6.66%
Mortgage Type
VA
Purchase Details
Closed on
Apr 17, 2008
Sold by
Fishman Barry A
Bought by
Fishman Patricia A
Purchase Details
Closed on
Mar 29, 1999
Sold by
Rose Robert L and Rose Carol S
Bought by
Fishman Barry A and Fishman Patricia A
Purchase Details
Closed on
Dec 29, 1998
Sold by
Rose Robert L and Rose Carol S
Bought by
Rose Robert L and Rose Carol S
Create a Home Valuation Report for This Property
The Home Valuation Report is an in-depth analysis detailing your home's value as well as a comparison with similar homes in the area
Home Values in the Area
Average Home Value in this Area
Purchase History
| Date | Buyer | Sale Price | Title Company |
|---|---|---|---|
| Jones Jared K | $180,000 | -- | |
| Jones David W | $154,900 | None Available | |
| Fishman Patricia A | -- | Attorney | |
| Fishman Barry A | $152,000 | -- | |
| Rose Robert L | -- | -- |
Source: Public Records
Mortgage History
| Date | Status | Borrower | Loan Amount |
|---|---|---|---|
| Closed | Jones Jared K | -- | |
| Previous Owner | Jones David W | $147,073 |
Source: Public Records
Tax History Compared to Growth
Tax History
| Year | Tax Paid | Tax Assessment Tax Assessment Total Assessment is a certain percentage of the fair market value that is determined by local assessors to be the total taxable value of land and additions on the property. | Land | Improvement |
|---|---|---|---|---|
| 2024 | $3,918 | $80,600 | $11,420 | $69,180 |
| 2023 | $3,918 | $80,600 | $11,420 | $69,180 |
| 2022 | $3,216 | $59,960 | $9,520 | $50,440 |
| 2021 | $3,256 | $59,960 | $9,520 | $50,440 |
| 2020 | $3,129 | $59,960 | $9,520 | $50,440 |
| 2019 | $2,707 | $48,700 | $8,850 | $39,850 |
| 2018 | $2,717 | $48,700 | $8,850 | $39,850 |
| 2017 | $2,644 | $48,700 | $8,850 | $39,850 |
| 2016 | $2,634 | $46,410 | $8,850 | $37,560 |
| 2015 | $2,640 | $46,410 | $8,850 | $37,560 |
| 2014 | $2,535 | $46,410 | $8,850 | $37,560 |
Source: Public Records
Map
Nearby Homes
- 1764 Highlander Dr
- 983 Echo Ct
- 460 Kinsey Rd
- 965 Oak Dale Dr
- 1359 Eagles Way
- 1311 Eagles Way
- 0 Mason Rd
- 0 Us 42 Unit 941174
- 1287 Brush Row Rd
- 656 Eden Roc Dr
- 610 Saxony Dr
- 15 Sexton Dr
- 513 Redbud Ln
- 508 Marshall Dr
- 1171 N Detroit St
- 1038 Frederick Dr
- 568 Louise Dr
- 2018 Tahoe Dr
- 902 N Bickett Rd
- 2537 Ridge Rd