Estimated Value: $194,000 - $270,000
3
Beds
2
Baths
1,602
Sq Ft
$154/Sq Ft
Est. Value
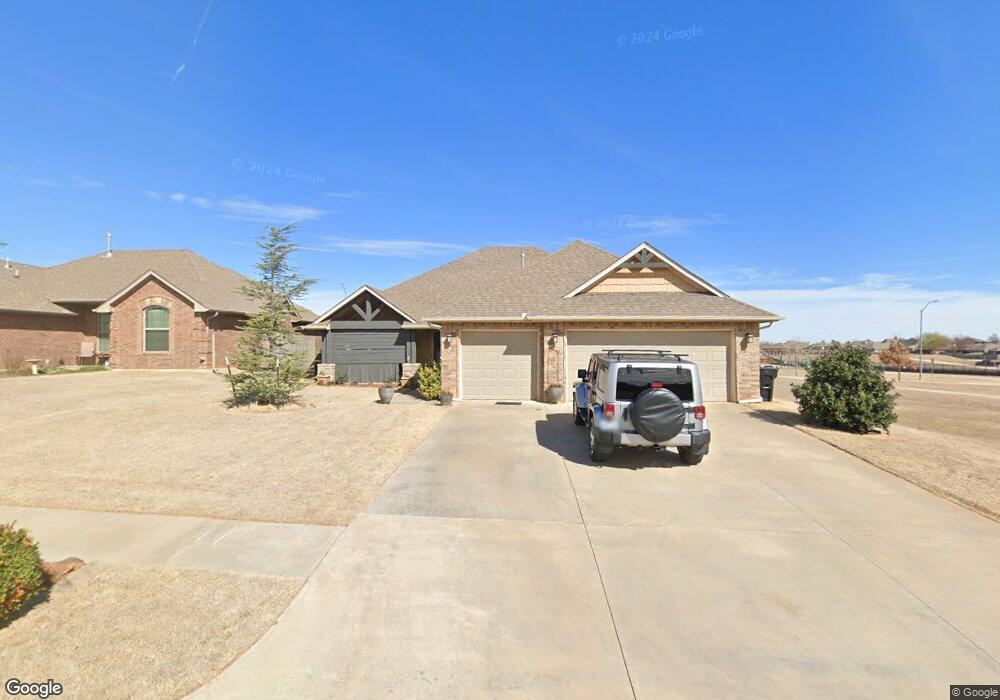
About This Home
This home is located at 683 SW 11th St, Moore, OK 73160 and is currently estimated at $246,796, approximately $154 per square foot. 683 SW 11th St is a home located in Cleveland County with nearby schools including Plaza Towers Elementary School, Highland West Junior High School, and Southmoore High School.
Ownership History
Date
Name
Owned For
Owner Type
Purchase Details
Closed on
Aug 21, 2015
Sold by
Dub Stone Construction Co
Bought by
Rivera Jesus A
Current Estimated Value
Home Financials for this Owner
Home Financials are based on the most recent Mortgage that was taken out on this home.
Original Mortgage
$155,168
Outstanding Balance
$121,079
Interest Rate
4.12%
Mortgage Type
FHA
Estimated Equity
$125,717
Purchase Details
Closed on
Jul 23, 2013
Sold by
Jackson Don and Jackson Misty
Bought by
Dub Stone Construction Co
Purchase Details
Closed on
Sep 26, 2006
Sold by
Kirby Gary and Kirby Rachel
Bought by
Jackson Don
Home Financials for this Owner
Home Financials are based on the most recent Mortgage that was taken out on this home.
Original Mortgage
$79,600
Interest Rate
6.44%
Mortgage Type
New Conventional
Create a Home Valuation Report for This Property
The Home Valuation Report is an in-depth analysis detailing your home's value as well as a comparison with similar homes in the area
Home Values in the Area
Average Home Value in this Area
Purchase History
| Date | Buyer | Sale Price | Title Company |
|---|---|---|---|
| Rivera Jesus A | $177,500 | American Eagle Title Group | |
| Dub Stone Construction Co | $10,000 | American Eagle Title Group | |
| Jackson Don | $80,000 | Capitol Abstract & Title |
Source: Public Records
Mortgage History
| Date | Status | Borrower | Loan Amount |
|---|---|---|---|
| Open | Rivera Jesus A | $155,168 | |
| Previous Owner | Jackson Don | $79,600 |
Source: Public Records
Tax History
| Year | Tax Paid | Tax Assessment Tax Assessment Total Assessment is a certain percentage of the fair market value that is determined by local assessors to be the total taxable value of land and additions on the property. | Land | Improvement |
|---|---|---|---|---|
| 2025 | $2,725 | $23,253 | $2,484 | $20,769 |
| 2023 | $2,550 | $21,919 | $2,682 | $19,237 |
| 2022 | $2,509 | $21,280 | $2,552 | $18,728 |
| 2021 | $2,444 | $20,661 | $2,040 | $18,621 |
| 2020 | $2,445 | $20,661 | $2,040 | $18,621 |
| 2019 | $2,490 | $20,661 | $2,040 | $18,621 |
| 2018 | $2,491 | $20,661 | $2,040 | $18,621 |
| 2017 | $2,504 | $20,661 | $0 | $0 |
| 2016 | $2,521 | $20,661 | $2,040 | $18,621 |
| 2015 | $117 | $1,008 | $1,008 | $0 |
| 2014 | $114 | $960 | $960 | $0 |
Source: Public Records
Map
Nearby Homes
- 690 SW 12th St
- 1301 Heather Ln
- 779 SW 14th St
- 849 SW 10th St
- 621 SW 7th St
- 925 SW 14th St
- 753 SW 4th Place
- 712 Penn Ln
- 764 SW 3rd St
- 1205 S Howard Ave
- 947 SW 4th Place
- 133 SW 14th St
- 13908 Broadway Ave
- 1025 SW 16th St
- 132 SW 16th St
- 209 S Irving Dr
- 936 SW 2nd St
- 14117 S Broadway Ave
- 117 SW 6th St
- 104 Broadway Cir
- 679 SW 11th St
- 687 SW 11th St
- 691 SW 11th St
- 675 SW 11th St
- 666 SW 11th St
- 664 SW 11th St
- 701 SW 11th St
- 671 SW 11th St
- 662 SW 11th St
- 674 SW 11th St
- 1608 NE 35th St
- 2816 Hazel Hollow
- 3400 Tahoe Dr
- 3516 Tahoe Dr
- 678 SW 11th St
- 705 SW 11th St
- 667 SW 11th St
- 1205 Dressen Dr
- 700 SW 11th St
- 658 SW 11th St
Your Personal Tour Guide
Ask me questions while you tour the home.