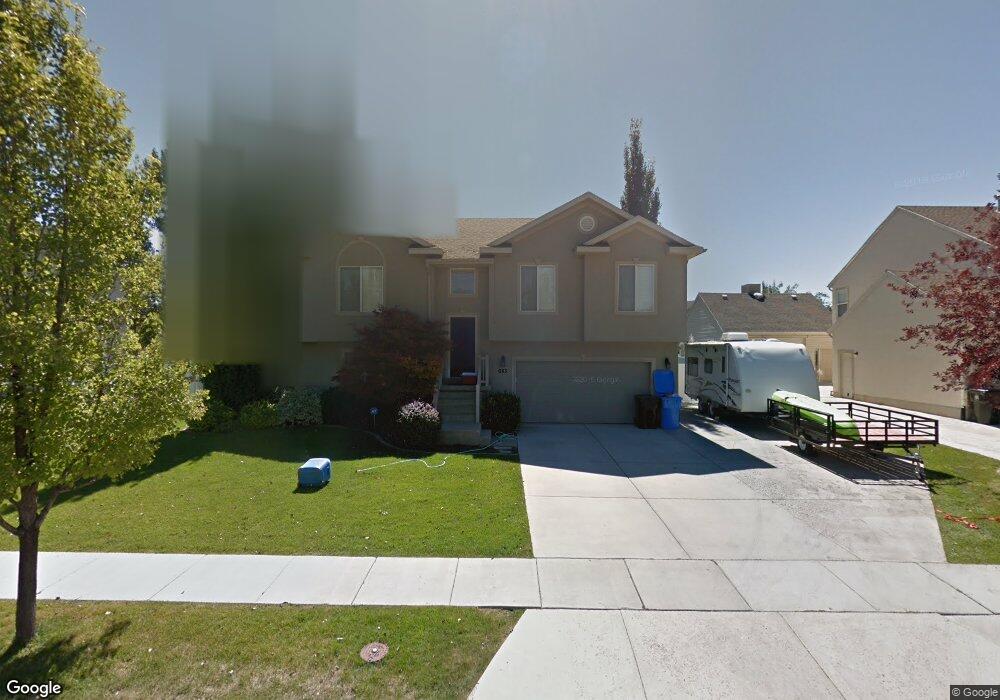
683 W 2090 N West Bountiful, UT 84087
Estimated Value: $670,000 - $766,000
5
Beds
4
Baths
1,883
Sq Ft
$371/Sq Ft
Est. Value
About This Home
This home is located at 683 W 2090 N, West Bountiful, UT 84087 and is currently estimated at $698,411, approximately $370 per square foot. 683 W 2090 N is a home located in Davis County with nearby schools including West Bountiful Elementary School, Bountiful Junior High School, and Viewmont High School.
Ownership History
Date
Name
Owned For
Owner Type
Purchase Details
Closed on
Oct 3, 2008
Sold by
Bohman Curtis D and Bohman Amy J
Bought by
Bohman Amy Joy and Bohman Curtis Dale
Current Estimated Value
Home Financials for this Owner
Home Financials are based on the most recent Mortgage that was taken out on this home.
Original Mortgage
$246,000
Outstanding Balance
$163,270
Interest Rate
6.39%
Mortgage Type
New Conventional
Estimated Equity
$535,141
Purchase Details
Closed on
Jan 9, 2004
Sold by
Argyle Acres Llc
Bought by
Bohman Curtis D and Bohman Amy J
Home Financials for this Owner
Home Financials are based on the most recent Mortgage that was taken out on this home.
Original Mortgage
$172,562
Interest Rate
5.88%
Mortgage Type
FHA
Create a Home Valuation Report for This Property
The Home Valuation Report is an in-depth analysis detailing your home's value as well as a comparison with similar homes in the area
Home Values in the Area
Average Home Value in this Area
Purchase History
| Date | Buyer | Sale Price | Title Company |
|---|---|---|---|
| Bohman Amy Joy | -- | Sundance Title Ins Ag Orem | |
| Bohman Curtis D | -- | Us Title Of Utah |
Source: Public Records
Mortgage History
| Date | Status | Borrower | Loan Amount |
|---|---|---|---|
| Open | Bohman Amy Joy | $246,000 | |
| Closed | Bohman Curtis D | $172,562 |
Source: Public Records
Tax History Compared to Growth
Tax History
| Year | Tax Paid | Tax Assessment Tax Assessment Total Assessment is a certain percentage of the fair market value that is determined by local assessors to be the total taxable value of land and additions on the property. | Land | Improvement |
|---|---|---|---|---|
| 2025 | $3,943 | $347,600 | $135,297 | $212,303 |
| 2024 | $3,688 | $332,750 | $111,128 | $221,622 |
| 2023 | $3,520 | $582,000 | $211,154 | $370,846 |
| 2022 | $3,643 | $337,150 | $100,547 | $236,603 |
| 2021 | $3,444 | $490,000 | $134,296 | $355,704 |
| 2020 | $2,639 | $368,000 | $125,662 | $242,338 |
| 2019 | $2,615 | $361,000 | $127,637 | $233,363 |
| 2018 | $2,428 | $330,000 | $129,136 | $200,864 |
| 2016 | $2,041 | $150,150 | $32,621 | $117,529 |
| 2015 | $2,000 | $139,920 | $32,621 | $107,299 |
| 2014 | $2,017 | $145,344 | $32,621 | $112,723 |
| 2013 | -- | $116,616 | $31,527 | $85,089 |
Source: Public Records
Map
Nearby Homes
- 580 W 2125 N
- 789 W 1950 N
- 2035 N 800 W
- 2257 N 830 W
- 2339 N 800 W
- 988 W 1950 N Unit 134
- 420 Rawlins Cir
- 239 Lyman Ln
- 234 Leah Cir
- 204 Lyman Ln
- 215 Lyman Ln
- 1503 N 300 W
- 825 W 1320 N
- 1084 W Audrey Ln Unit 20
- 1084 W Audrey Ln
- 353 Florentine Ln
- 2 S 285 W
- 147 N 360 W Unit 21
- 117 Cara Vella Ln
- 235 W 1400 N