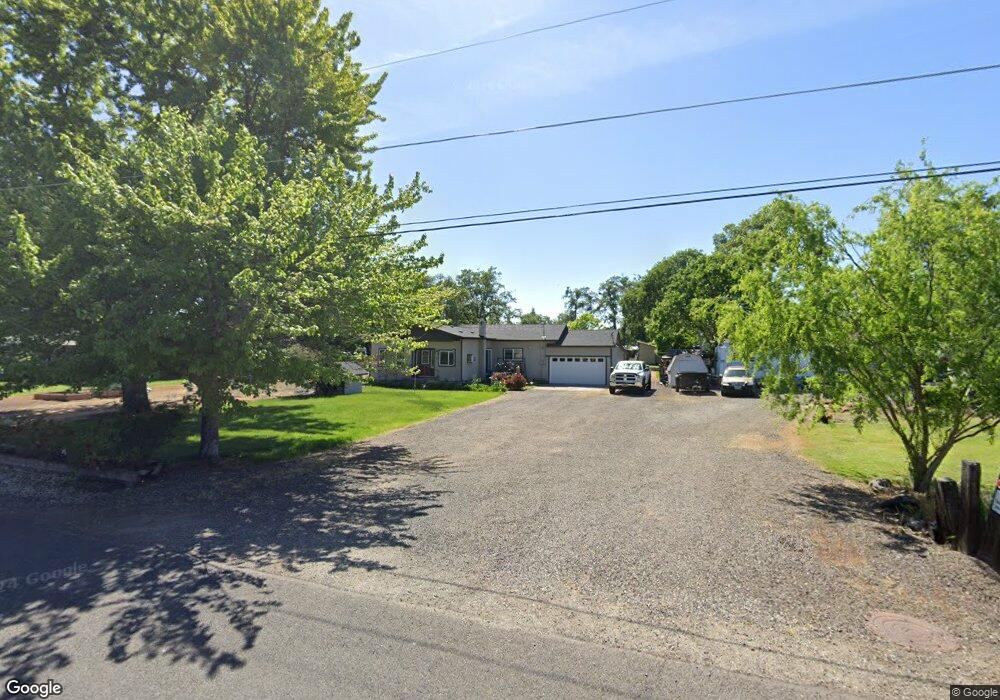
6831 Oakhurst St Central Point, OR 97502
Estimated Value: $357,021 - $396,000
3
Beds
2
Baths
1,529
Sq Ft
$250/Sq Ft
Est. Value
About This Home
This home is located at 6831 Oakhurst St, Central Point, OR 97502 and is currently estimated at $383,007, approximately $250 per square foot. 6831 Oakhurst St is a home located in Jackson County with nearby schools including Sams Valley Elementary School, Scenic Middle School, and Crater High School.
Ownership History
Date
Name
Owned For
Owner Type
Purchase Details
Closed on
Jun 9, 2008
Sold by
Horn Sherry L and Horn Michael K
Bought by
Horn Sherry L and Horn Michael K
Current Estimated Value
Home Financials for this Owner
Home Financials are based on the most recent Mortgage that was taken out on this home.
Original Mortgage
$50,000
Outstanding Balance
$32,085
Interest Rate
6.05%
Mortgage Type
Credit Line Revolving
Estimated Equity
$350,922
Purchase Details
Closed on
May 5, 2008
Sold by
Moore Sherry L and Horn Sherry L
Bought by
Horn Sherry L and Horn Michael K
Home Financials for this Owner
Home Financials are based on the most recent Mortgage that was taken out on this home.
Original Mortgage
$50,000
Outstanding Balance
$32,085
Interest Rate
6.05%
Mortgage Type
Credit Line Revolving
Estimated Equity
$350,922
Purchase Details
Closed on
Aug 4, 2006
Sold by
Moore David R and Moore Sherry L
Bought by
Moore Sherry L
Purchase Details
Closed on
Mar 11, 2006
Sold by
Sarratt Onnie W and Sarratt Lottie L
Bought by
Moore David R and Moore Sherry L
Create a Home Valuation Report for This Property
The Home Valuation Report is an in-depth analysis detailing your home's value as well as a comparison with similar homes in the area
Home Values in the Area
Average Home Value in this Area
Purchase History
| Date | Buyer | Sale Price | Title Company |
|---|---|---|---|
| Horn Sherry L | -- | None Available | |
| Horn Sherry L | -- | None Available | |
| Moore Sherry L | -- | None Available | |
| Moore David R | -- | None Available |
Source: Public Records
Mortgage History
| Date | Status | Borrower | Loan Amount |
|---|---|---|---|
| Open | Horn Sherry L | $50,000 |
Source: Public Records
Tax History Compared to Growth
Tax History
| Year | Tax Paid | Tax Assessment Tax Assessment Total Assessment is a certain percentage of the fair market value that is determined by local assessors to be the total taxable value of land and additions on the property. | Land | Improvement |
|---|---|---|---|---|
| 2025 | $2,074 | $200,370 | $112,530 | $87,840 |
| 2024 | $2,074 | $194,540 | $75,440 | $119,100 |
| 2023 | $2,005 | $188,880 | $73,250 | $115,630 |
| 2022 | $1,962 | $188,880 | $73,250 | $115,630 |
| 2021 | $1,907 | $183,380 | $71,110 | $112,270 |
| 2020 | $1,851 | $178,040 | $69,040 | $109,000 |
| 2019 | $1,808 | $167,830 | $65,070 | $102,760 |
| 2018 | $1,752 | $162,950 | $63,180 | $99,770 |
| 2017 | $1,711 | $162,950 | $63,180 | $99,770 |
| 2016 | $1,661 | $153,610 | $59,550 | $94,060 |
| 2015 | $1,584 | $153,610 | $59,550 | $94,060 |
| 2014 | $1,546 | $144,800 | $56,140 | $88,660 |
Source: Public Records
Map
Nearby Homes
- 1729 E Gregory Rd
- 644 Raven
- 6850 Downing Rd Unit 44
- 6850 Downing Rd Unit 65
- 225 Wilson Rd
- 6348 Crater Lake Hwy
- 9889 SE Pavati Dr
- 1182 E Justice Rd
- 5156 Peace Ln
- 2035 Rabun Way
- 2598 St James Way
- 2507 Agate Meadows
- 2330 Savannah Dr
- 2248 Evan Way
- 1409 Twin Rocks Dr
- 2225 New Haven Dr
- 6199 Wilson Ln
- 4824 Airway Dr Unit 371W06BB410
- 2618 Carr St
- 4676 Industry Dr
- 6845 Oakhurst St
- 6807 Oakhurst St
- 6865 Oakhurst St
- 6789 Oakhurst St
- 6838 Oakhurst St
- 6828 Pinehurst St
- 215 Laurelhurst St
- 6856 Pinehurst St
- 6870 Oakhurst St
- 6883 Oakhurst St
- 6832 Pinehurst St
- 6798 Oakhurst St
- 6915 Oakhurst St
- 177 Laurelhurst St
- 210 Laurelhurst St
- 171 Laurelhurst St
- 194 Laurelhurst St
- 6894 Oakhurst St
- 6904 Pinehurst St