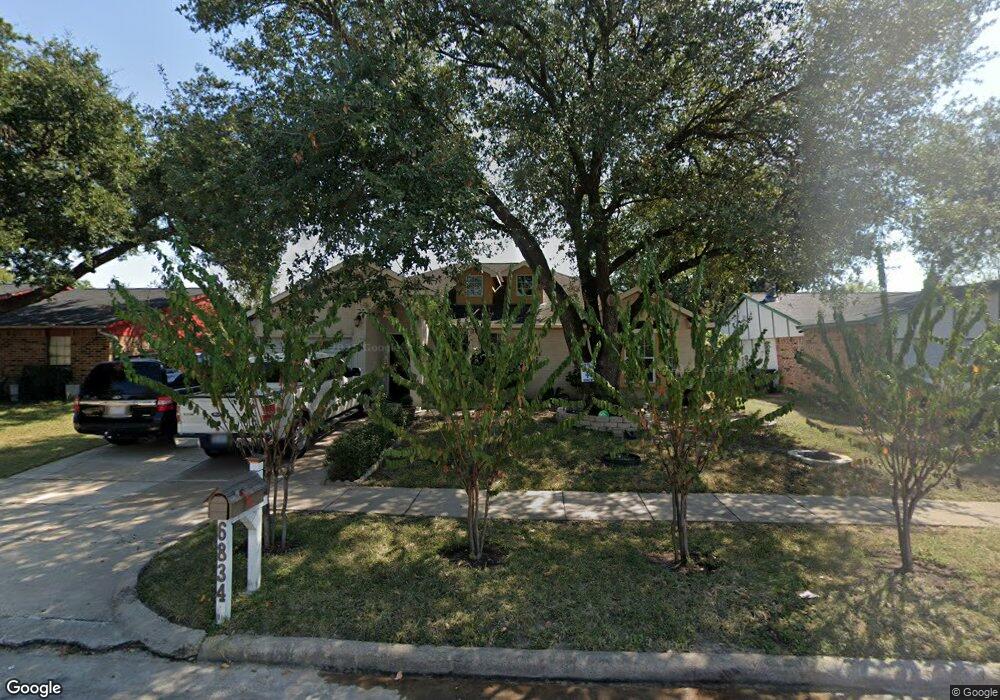
6834 Glenstein Dr Houston, TX 77084
Estimated Value: $255,000 - $280,000
3
Beds
2
Baths
1,882
Sq Ft
$145/Sq Ft
Est. Value
About This Home
This home is located at 6834 Glenstein Dr, Houston, TX 77084 and is currently estimated at $272,142, approximately $144 per square foot. 6834 Glenstein Dr is a home located in Harris County with nearby schools including Metcalf Elementary School, Kahla Middle School, and Langham Creek High School.
Ownership History
Date
Name
Owned For
Owner Type
Purchase Details
Closed on
Jun 29, 2012
Sold by
Crabtree Noris and Bispo Aroldo
Bought by
Bezanilla Gonzalo
Current Estimated Value
Purchase Details
Closed on
Jan 18, 2007
Sold by
Crabtree Noris
Bought by
Bispo Aroldo and Crabtree Noris
Purchase Details
Closed on
Feb 28, 2005
Sold by
Crabtree Scott and Crabtree Phillip
Bought by
Crabtree Noris
Home Financials for this Owner
Home Financials are based on the most recent Mortgage that was taken out on this home.
Original Mortgage
$73,600
Interest Rate
5.71%
Mortgage Type
New Conventional
Purchase Details
Closed on
Aug 2, 1996
Sold by
Wayne Holtkamp Inc
Bought by
Crabtre Roy P and Crabtree Noris
Home Financials for this Owner
Home Financials are based on the most recent Mortgage that was taken out on this home.
Original Mortgage
$49,000
Interest Rate
8.33%
Mortgage Type
Seller Take Back
Create a Home Valuation Report for This Property
The Home Valuation Report is an in-depth analysis detailing your home's value as well as a comparison with similar homes in the area
Home Values in the Area
Average Home Value in this Area
Purchase History
| Date | Buyer | Sale Price | Title Company |
|---|---|---|---|
| Bezanilla Gonzalo | -- | North American Title Co | |
| Bispo Aroldo | -- | None Available | |
| Crabtree Noris | -- | First American Title | |
| Crabtre Roy P | -- | -- |
Source: Public Records
Mortgage History
| Date | Status | Borrower | Loan Amount |
|---|---|---|---|
| Previous Owner | Crabtree Noris | $73,600 | |
| Previous Owner | Crabtre Roy P | $49,000 |
Source: Public Records
Tax History Compared to Growth
Tax History
| Year | Tax Paid | Tax Assessment Tax Assessment Total Assessment is a certain percentage of the fair market value that is determined by local assessors to be the total taxable value of land and additions on the property. | Land | Improvement |
|---|---|---|---|---|
| 2025 | $1,211 | $322,400 | $49,863 | $272,537 |
| 2024 | $1,211 | $317,261 | $49,863 | $267,398 |
| 2023 | $1,211 | $328,739 | $49,863 | $278,876 |
| 2022 | $5,873 | $296,032 | $38,430 | $257,602 |
| 2021 | $5,583 | $231,041 | $38,430 | $192,611 |
| 2020 | $5,213 | $210,520 | $34,936 | $175,584 |
| 2019 | $4,886 | $190,000 | $22,232 | $167,768 |
| 2018 | $927 | $155,000 | $22,232 | $132,768 |
| 2017 | $4,509 | $170,884 | $22,232 | $148,652 |
| 2016 | $4,099 | $143,000 | $19,056 | $123,944 |
| 2015 | $2,058 | $165,859 | $16,515 | $149,344 |
| 2014 | $2,058 | $158,942 | $16,515 | $142,427 |
Source: Public Records
Map
Nearby Homes
- 17250 April Valley Ct
- 17325 Fm 529 Rd
- 17250 Cricketbriar Ct
- 17602 Wild Willow Ln
- 17219 Glenpatti Dr
- 17311 Northern Star Dr
- 17414 Davenway Dr
- 17234 Rush Trace Ct
- 17602 Kakerglen Ct
- 17715 Glenpatti Dr
- 17419 Lobo Trail
- 6602 Loch Bruceray Dr
- 17726 Wild Willow Ln
- 6523 Vanlynn Ln
- 6839 Catarina Cir
- 17731 Wild Willow Ln
- 17015 Sky Blue Place
- 17819 Wild Willow Ln
- 17902 Autumn Hills Dr
- 17003 Summer Dew Ln
- 6838 Glenstein Dr
- 6830 Glenstein Dr
- 6826 Glenstein Dr
- 17407 Autumn Trails Ln
- 6846 Glenstein Dr
- 17402 N Yorkglen Dr
- 6822 Glenstein Dr
- 17406 N Yorkglen Dr
- 17502 Poppy Trails Ln
- 17322 N Yorkglen Dr
- 17402 Autumn Trails Ln
- 6850 Glenstein Dr
- 17406 Autumn Trails Ln
- 17415 Autumn Trails Ln
- 6818 Glenstein Dr
- 17410 S Yorkglen Dr
- 17410 Autumn Trails Ln
- 17318 N Yorkglen Dr
- 6854 Glenstein Dr
- 17414 N Yorkglen Dr