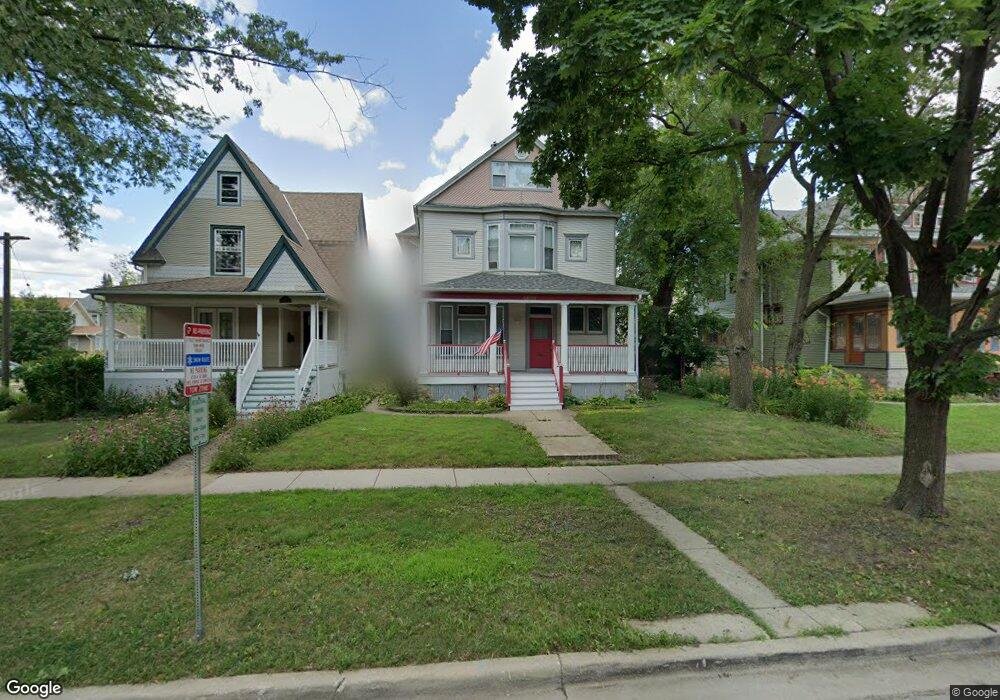
6835 34th St Berwyn, IL 60402
Estimated Value: $428,910 - $610,000
3
Beds
2
Baths
2,673
Sq Ft
$201/Sq Ft
Est. Value
About This Home
This home is located at 6835 34th St, Berwyn, IL 60402 and is currently estimated at $536,228, approximately $200 per square foot. 6835 34th St is a home located in Cook County with nearby schools including Irving Elementary School, Heritage Middle School, and J. Sterling Morton High School West.
Ownership History
Date
Name
Owned For
Owner Type
Purchase Details
Closed on
Jan 28, 2011
Sold by
Pantic Sinisa and Ristic Suncica
Bought by
Bargas Victor A and Deleon Pablo
Current Estimated Value
Home Financials for this Owner
Home Financials are based on the most recent Mortgage that was taken out on this home.
Original Mortgage
$217,500
Outstanding Balance
$1,686
Interest Rate
4.76%
Mortgage Type
New Conventional
Estimated Equity
$534,542
Purchase Details
Closed on
Mar 20, 2002
Sold by
Cory Kevin D and Cory Sara
Bought by
Pantic Sinisa and Ristic Suncica
Home Financials for this Owner
Home Financials are based on the most recent Mortgage that was taken out on this home.
Original Mortgage
$177,000
Interest Rate
6.93%
Purchase Details
Closed on
Mar 18, 1996
Sold by
Palmisano Jerry J and Palmisano Kathy
Bought by
Cory Kevin D
Home Financials for this Owner
Home Financials are based on the most recent Mortgage that was taken out on this home.
Original Mortgage
$189,700
Interest Rate
7.06%
Mortgage Type
VA
Create a Home Valuation Report for This Property
The Home Valuation Report is an in-depth analysis detailing your home's value as well as a comparison with similar homes in the area
Home Values in the Area
Average Home Value in this Area
Purchase History
| Date | Buyer | Sale Price | Title Company |
|---|---|---|---|
| Bargas Victor A | $290,000 | Pntn | |
| Pantic Sinisa | $236,000 | -- | |
| Cory Kevin D | $186,000 | Attorneys Natl Title Network |
Source: Public Records
Mortgage History
| Date | Status | Borrower | Loan Amount |
|---|---|---|---|
| Open | Bargas Victor A | $217,500 | |
| Previous Owner | Pantic Sinisa | $177,000 | |
| Previous Owner | Cory Kevin D | $189,700 |
Source: Public Records
Tax History
| Year | Tax Paid | Tax Assessment Tax Assessment Total Assessment is a certain percentage of the fair market value that is determined by local assessors to be the total taxable value of land and additions on the property. | Land | Improvement |
|---|---|---|---|---|
| 2025 | $12,042 | $37,000 | $6,300 | $30,700 |
| 2024 | $12,042 | $37,000 | $6,300 | $30,700 |
| 2023 | $12,179 | $37,000 | $6,300 | $30,700 |
| 2022 | $12,179 | $30,225 | $5,513 | $24,712 |
| 2021 | $13,323 | $30,223 | $5,512 | $24,711 |
| 2020 | $12,592 | $30,223 | $5,512 | $24,711 |
| 2019 | $10,062 | $22,326 | $5,040 | $17,286 |
| 2018 | $9,472 | $22,326 | $5,040 | $17,286 |
| 2017 | $10,523 | $24,237 | $5,040 | $19,197 |
| 2016 | $8,811 | $20,317 | $4,252 | $16,065 |
| 2015 | $8,637 | $20,317 | $4,252 | $16,065 |
| 2014 | $9,566 | $23,333 | $4,252 | $19,081 |
| 2013 | $10,191 | $27,953 | $4,252 | $23,701 |
Source: Public Records
Map
Nearby Homes
- 3330 Grove Ave Unit 1S
- 3303 Grove Ave Unit 310
- 3421 Oak Park Ave
- 3416 Euclid Ave
- 3548 Clinton Ave
- 7048 35th St
- 3601 Euclid Ave
- 3636 Oak Park Ave
- 6828 30th Place
- 3031 Oak Park Ave
- 3724 Oak Park Ave
- 3729 Grove Ave
- 3715 Euclid Ave
- 3742 Clinton Ave
- 475 Shenstone Rd Unit 104
- 475 Shenstone Rd Unit 304
- 475 Shenstone Rd Unit 303
- 3019 Wesley Ave
- 484 Shenstone Rd
- 3002 Wesley Ave
- 6839 34th St
- 6831 34th St
- 999 Confidential Ave
- 99999999 Confidential Blvd
- 2324 Park Oak Ave
- 3333 Kenilworth Ave
- 6901 34th St
- 6901 34th St
- 3329 Kenilworth Ave
- 3334 Grove Ave
- 3327 Kenilworth Ave Unit S
- 6905 34th St
- 3325 Kenilworth Ave
- 3332 Kenilworth Ave
- 6832 34th St
- 6909 34th St
- 3330 Grove Ave Unit 2S
- 3330 Grove Ave Unit 3N
- 3330 Grove Ave Unit 1N
- 3330 Grove Ave Unit 3S
Your Personal Tour Guide
Ask me questions while you tour the home.