NOT LISTED FOR SALE

6835 Huron Ave Hammond, IN 46323

Estimated Value: $150,000 - $182,181

3 Beds
1 Bath
1,600 Sq Ft
$106/Sq Ft Est. Value

Last Sold November 17, 2022

Last sale price $132,550 $83 Per Sq Ft

Est. 28% increase in value since last sale

Current estimated payment $1,073/month

About This Home

As of November 2022

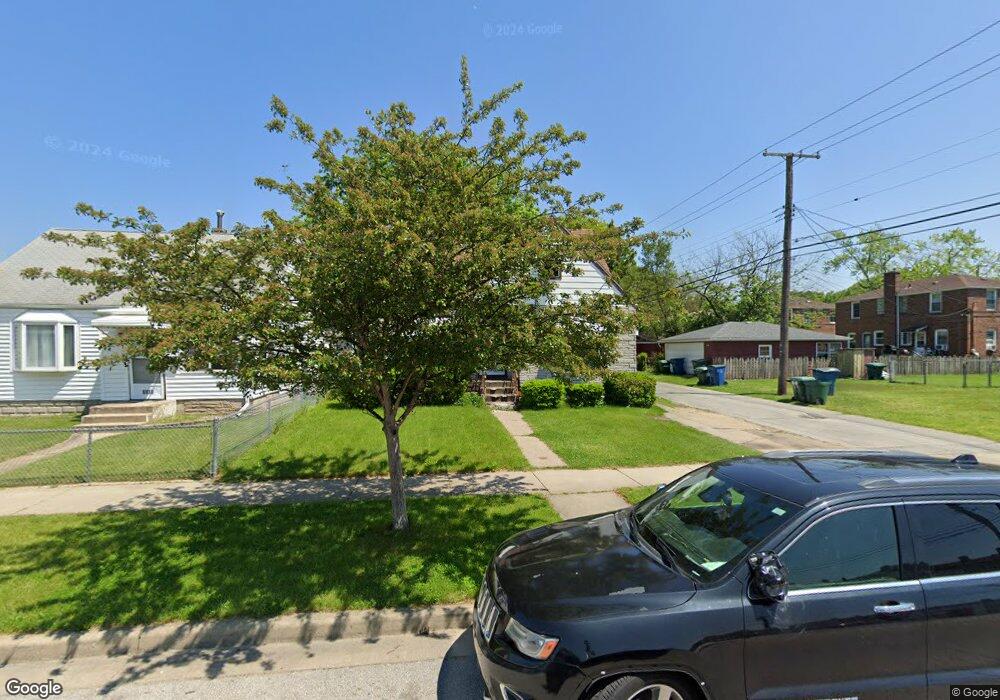
ABSOLUTE AUCTION, ONLINE BIDDING NOW OPEN! This home has the three most important things in real estate: Location, Location, Location! Conveniently located across the street from Purdue Northwest this home has the potential for a student housing rental home. The two story home was built in 1943 and features 3 bedrooms, 1 full bath, full basement, and 1600 square feet of space. Detached from the home is a 3 car garage with 744 square feet of space that was built in 1972. Sitting on a 0.11 acre corner lot. Do not pass up this opportunity to bid your price at auction on this unique investment opportunity. Taxes 2021 Pay 2022: $425.24 (with exemptions).

Ownership History

Date Name Owned For Owner Type

Purchase Details

Listed on
Oct 12, 2022
Closed on
Nov 11, 2022
Sold by
Hausenfleck Elizabeth
Bought by
Hausenfleck Mark A and De Terrazas Maria
Seller's Agent
Jay Mayden
Kraft Real Estate Services, LL
Buyer's Agent
Non-Member Agent
Non-Member MLS Office
List Price
$132,550
Sold Price
$132,550
Current Estimated Value
$169,795

Home Financials for this Owner

Home Financials are based on the most recent Mortgage that was taken out on this home.
Estimated Appreciation
$37,245
Avg. Annual Appreciation
9.04%
Source: Public Records

Range of Values:

Collateral Analytics

Collateral Analytics Collateral Analytics AVMs (Automated Valuation Model) employ a number of statistical approaches combined with neighborhood-specific comparable selection guarantees the most up-to-date and precise valuations.

Not Available

Collateral Analytics does not have data for the current month. Please view the chart for historical values.

ICE

ICE Mortgage Technology ICE Mortgage Technology’s AVM (Automated Valuation Model) is a state-of-the-art online residential property valuation tool that provides a quick and accurate estimate of the value of almost any home in the U.S.

Not Available

ICE Mortgage Technology does not have data for the current month. Please view the chart for historical values.

First American

First American First American Data & Analytics’ next-generation AVM combines unrivaled data assets with a blended ensemble of valuation models to produce highly accurate, reliable valuations you can trust.

Not Available

First American does not have data for the current month. Please view the chart for historical values.

Quantarium

Quantarium Quantarium’s valuation service, repeatedly proven the industry’s most accurate and comprehensive, is supercharged with a self-learning and auto-tuning AI engine that continually becomes smarter and more accurate as it processes daily inputs from the industry’s leading RE data lake.

Not Available

Quantarium does not have data for the current month. Please view the chart for historical values.

Average Value
Not Available
List Price
Sold Price
Create a Home Valuation Report for This Property
The Home Valuation Report is an in-depth analysis detailing your home's value as well as a comparison with similar homes in the area

Home Values in the Area

Source: Public Records

Average Home Value in this Area


Source: Public Records

Purchase History

Date Buyer Sale Price Title Company
Hausenfleck Mark A -- Community Title
Source: Public Records

Property History

Date Event Price List to Sale Price per Sq Ft Prior Sale
11/17/2022 11/17/22 Sold $132,550 0.0% $83 / Sq Ft View Prior Sale
10/27/2022 10/27/22 Pending -- -- --
10/12/2022 10/12/22 For Sale $132,550 -- $83 / Sq Ft

Tax History Compared to Growth

Source: Public Records

Tax History

Year Tax Paid Tax Assessment Tax Assessment Total Assessment is a certain percentage of the fair market value that is determined by local assessors to be the total taxable value of land and additions on the property. Land Improvement
2024 $6,476 $149,100 $23,100 $126,000
2023 $339 $135,500 $23,100 $112,400
2022 $339 $115,300 $23,100 $92,200
2021 $332 $97,500 $14,500 $83,000
2020 $326 $92,200 $14,500 $77,700
2019 $423 $83,400 $14,500 $68,900
2018 $373 $77,600 $13,200 $64,400
2017 $367 $76,200 $13,200 $63,000
2016 $361 $74,100 $13,200 $60,900
2014 $340 $76,300 $10,200 $66,100
2013 $349 $77,000 $10,200 $66,800
Source: Public Records

Agents Affiliated with this Home

  • Section Image
See All Agents

Map