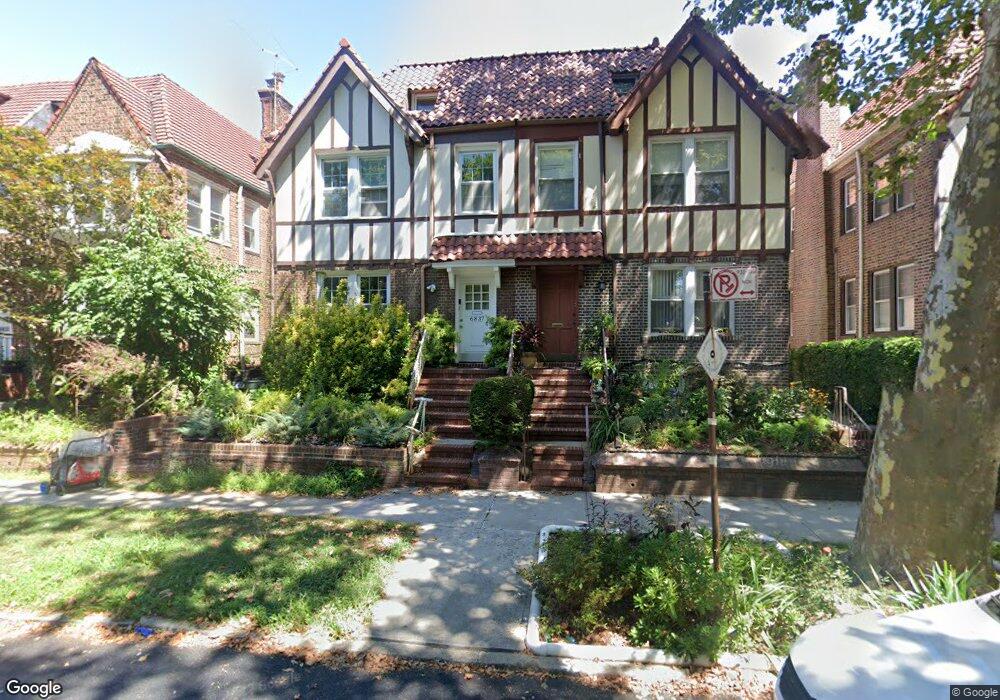
6837 Dartmouth St Forest Hills, NY 11375
Forest Hills NeighborhoodEstimated Value: $1,812,000 - $2,120,000
--
Bed
--
Bath
4,080
Sq Ft
$479/Sq Ft
Est. Value
About This Home
This home is located at 6837 Dartmouth St, Forest Hills, NY 11375 and is currently estimated at $1,955,660, approximately $479 per square foot. 6837 Dartmouth St is a home located in Queens County with nearby schools including Ps 144 Col Jeromus Remsen, J.H.S. 190 Russell Sage, and Queens Metropolitan High School.
Ownership History
Date
Name
Owned For
Owner Type
Purchase Details
Closed on
Aug 7, 2007
Sold by
Aliazzo Bonnie and Aliazzo Frank R
Bought by
Depena Kelvin and Yuan Virginia Hoa
Current Estimated Value
Home Financials for this Owner
Home Financials are based on the most recent Mortgage that was taken out on this home.
Original Mortgage
$87,000
Outstanding Balance
$55,421
Interest Rate
6.78%
Estimated Equity
$1,900,239
Purchase Details
Closed on
Sep 29, 2003
Sold by
Aliazzo Frank Robert
Bought by
Aliazzo Bonnie and Fiddlers Green Spur
Home Financials for this Owner
Home Financials are based on the most recent Mortgage that was taken out on this home.
Original Mortgage
$282,000
Interest Rate
6.01%
Mortgage Type
Purchase Money Mortgage
Create a Home Valuation Report for This Property
The Home Valuation Report is an in-depth analysis detailing your home's value as well as a comparison with similar homes in the area
Home Values in the Area
Average Home Value in this Area
Purchase History
| Date | Buyer | Sale Price | Title Company |
|---|---|---|---|
| Depena Kelvin | $1,185,000 | -- | |
| Depena Kelvin | $1,185,000 | -- | |
| Aliazzo Bonnie | -- | -- | |
| Aliazzo Bonnie | $270,000 | -- | |
| Aliazzo Bonnie | -- | -- | |
| Aliazzo Bonnie | $270,000 | -- |
Source: Public Records
Mortgage History
| Date | Status | Borrower | Loan Amount |
|---|---|---|---|
| Open | Depena Kelvin | $87,000 | |
| Closed | Depena Kelvin | $87,000 | |
| Open | Depena Kelvin | $948,000 | |
| Closed | Depena Kelvin | $948,000 | |
| Previous Owner | Aliazzo Bonnie | $282,000 |
Source: Public Records
Tax History Compared to Growth
Tax History
| Year | Tax Paid | Tax Assessment Tax Assessment Total Assessment is a certain percentage of the fair market value that is determined by local assessors to be the total taxable value of land and additions on the property. | Land | Improvement |
|---|---|---|---|---|
| 2025 | $15,804 | $79,973 | $7,831 | $72,142 |
| 2024 | $15,804 | $78,684 | $7,236 | $71,448 |
| 2023 | $14,940 | $74,383 | $6,802 | $67,581 |
| 2022 | $13,790 | $137,460 | $14,700 | $122,760 |
| 2021 | $13,729 | $134,760 | $14,700 | $120,060 |
| 2020 | $13,811 | $123,720 | $14,700 | $109,020 |
| 2019 | $13,424 | $105,960 | $14,700 | $91,260 |
| 2018 | $12,338 | $61,986 | $9,913 | $52,073 |
| 2017 | $11,679 | $58,761 | $10,153 | $48,608 |
| 2016 | $10,793 | $58,761 | $10,153 | $48,608 |
| 2015 | $6,466 | $55,537 | $14,824 | $40,713 |
| 2014 | $6,466 | $54,642 | $14,877 | $39,765 |
Source: Public Records
Map
Nearby Homes
- 68-11 Dartmouth St
- 6851 Clyde St
- 68-30 Burns St Unit 3D
- 68-20 Burns St Unit B2
- 68-20 Burns St Unit E1
- 68-12 Burns St Unit D4
- 67-60 Exeter St
- 71-11 Yellowstone Blvd Unit 7R
- 71-11 Yellowstone Blvd Unit 5K
- 71-11 Yellowstone Blvd Unit 4A
- 71-11 Yellowstone Blvd Unit 6H
- 71-11 Yellowstone Blvd Unit 5J
- 71-11 Yellowstone Blvd Unit 4B
- 6836 Groton St
- 70-25 Yellowstone Blvd Unit 10-X
- 70-25 Yellowstone Blvd Unit 2M
- 70-25 Yellowstone Blvd Unit 21Q
- 70-25 Yellowstone Blvd Unit 21R
- 70-25 Yellowstone Blvd Unit 1 Y
- 70-25 Yellowstone Blvd Unit 10Z
- 6839 Dartmouth St Unit 2nd Fl
- 68-39 Dartmouth St
- 68-39 Dartmouth St Unit 2nd Fl
- 6833 Dartmouth St
- 6839 Dartmouth St
- 68-33 Dartmouth St Unit 2nd Fl
- 68-33 Dartmouth St Unit 2 Fl
- 68-33 Dartmouth St Unit 1 Fl
- 6841 Dartmouth St
- 6831 Dartmouth St
- 68-41 Dartmouth St Unit 2
- 6843 Dartmouth St
- 6843 Dartmouth St Unit B
- 6843 Dartmouth St Unit A
- 68-43 Dartmouth St Unit B
- 6829 Dartmouth St
- 6847 Dartmouth St
- 6827 Dartmouth St
- 6836 Clyde St
- 6838 Clyde St