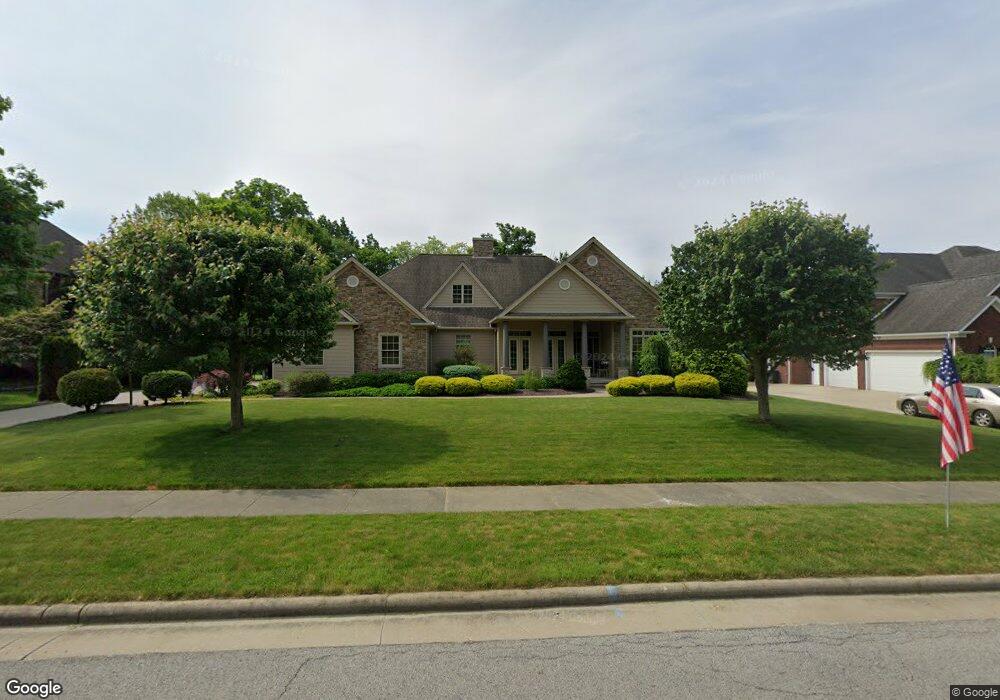
6837 Kyle Ridge Pointe Canfield, OH 44406
Estimated Value: $688,125 - $846,000
3
Beds
3
Baths
2,688
Sq Ft
$279/Sq Ft
Est. Value
About This Home
This home is located at 6837 Kyle Ridge Pointe, Canfield, OH 44406 and is currently estimated at $750,708, approximately $279 per square foot. 6837 Kyle Ridge Pointe is a home with nearby schools including Canfield Village Middle School, Canfield High School, and St Charles Elementary School.
Ownership History
Date
Name
Owned For
Owner Type
Purchase Details
Closed on
Aug 28, 2017
Sold by
Gavozzi Florecne C
Bought by
Gavozzi Theodore
Current Estimated Value
Purchase Details
Closed on
Jul 5, 2006
Sold by
Gavozzi Theodore and Gavozzi Rose Ann
Bought by
Gavozzi Rose Ann
Purchase Details
Closed on
Apr 24, 2006
Sold by
J & J Builders Inc
Bought by
Gavozzi Theodore and Gavozzi Rose Ann
Home Financials for this Owner
Home Financials are based on the most recent Mortgage that was taken out on this home.
Original Mortgage
$247,485
Interest Rate
5.5%
Mortgage Type
Purchase Money Mortgage
Purchase Details
Closed on
Jul 7, 2005
Sold by
C T W Development Corp
Bought by
J & J Builders Inc
Create a Home Valuation Report for This Property
The Home Valuation Report is an in-depth analysis detailing your home's value as well as a comparison with similar homes in the area
Home Values in the Area
Average Home Value in this Area
Purchase History
| Date | Buyer | Sale Price | Title Company |
|---|---|---|---|
| Gavozzi Theodore | -- | None Available | |
| Gavozzi Rose Ann | -- | None Available | |
| Gavozzi Theodore | $357,500 | None Available | |
| J & J Builders Inc | $70,000 | -- |
Source: Public Records
Mortgage History
| Date | Status | Borrower | Loan Amount |
|---|---|---|---|
| Previous Owner | Gavozzi Theodore | $247,485 |
Source: Public Records
Tax History Compared to Growth
Tax History
| Year | Tax Paid | Tax Assessment Tax Assessment Total Assessment is a certain percentage of the fair market value that is determined by local assessors to be the total taxable value of land and additions on the property. | Land | Improvement |
|---|---|---|---|---|
| 2024 | $7,151 | $184,600 | $31,500 | $153,100 |
| 2023 | $7,057 | $184,600 | $31,500 | $153,100 |
| 2022 | $7,537 | $158,530 | $29,750 | $128,780 |
| 2021 | $7,301 | $158,530 | $29,750 | $128,780 |
| 2020 | $7,332 | $158,530 | $29,750 | $128,780 |
| 2019 | $6,944 | $136,180 | $29,750 | $106,430 |
| 2018 | $6,697 | $136,180 | $29,750 | $106,430 |
| 2017 | $6,694 | $136,180 | $29,750 | $106,430 |
| 2016 | $6,168 | $120,570 | $21,000 | $99,570 |
| 2015 | $6,032 | $120,570 | $21,000 | $99,570 |
| 2014 | -- | $120,570 | $21,000 | $99,570 |
| 2013 | $5,836 | $120,570 | $21,000 | $99,570 |
Source: Public Records
Map
Nearby Homes
- 7171 Paddington Rowe
- 6879 Kyle Ridge Pointe
- 7245 Hanbury Close
- 6957 Tippecanoe Rd
- 6911 Tippecanoe Rd
- 3821 Mercedes Place
- 6873 Tippecanoe Rd
- 6670 Seville Dr
- 7526 Huntington Dr
- 6729 Tippecanoe Rd Unit 2
- 6729 Tippecanoe Rd Unit 6
- 7492 Huntington Dr Unit 12
- 2319 Hunters Ridge
- 6845 Abbey Rd
- 6843 Abbey Rd
- 6837 Abbey Rd S
- 1133 Red Tail Hawk Ct Unit 6
- 5034 Macy Ln
- 4052 Saint Andrews Ct Unit 3
- 5025 Macy Ln
- 6841 Kyle Ridge Pointe
- 6833 Kyle Ridge Pointe
- 6845 Kyle Ridge Pointe
- 6829 Kyleridge Point
- 6829 Kyle Ridge Pointe
- 6836 Kyle Ridge Pointe
- 6844 Kyle Ridge Pointe
- 6832 Kyle Ridge Pointe
- 6849 Kyle Ridge Pointe
- 6848 Kyle Ridge Pointe
- 6828 Kyle Ridge Pointe
- 6852 Kyle Ridge Point
- 6852 Kyle Ridge Pointe
- 6853 Kyle Ridge Pointe
- 6824 Kyle Ridge Pointe
- 6856 Kyle Ridge Pointe
- 6820 Kyle Ridge Pointe
- 6860 Kyle Ridge Pointe
- 6861 Kyle Ridge Pointe
- 6864 Kyle Ridge Pointe