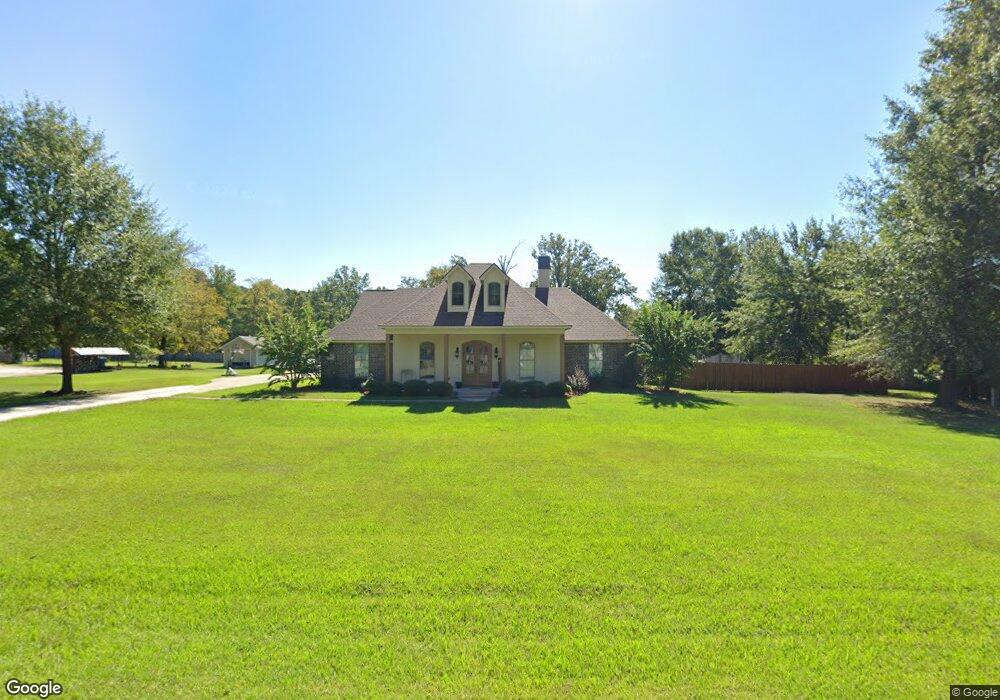
6837 N Club Loop Shreveport, LA 71107
Estimated Value: $315,000 - $348,000
3
Beds
4
Baths
2,684
Sq Ft
$125/Sq Ft
Est. Value
About This Home
This home is located at 6837 N Club Loop, Shreveport, LA 71107 and is currently estimated at $335,660, approximately $125 per square foot. 6837 N Club Loop is a home with nearby schools including Blanchard Elementary School, Judson Fundamental Elementary School, and Fairfield Magnet School.
Ownership History
Date
Name
Owned For
Owner Type
Purchase Details
Closed on
Sep 21, 2012
Sold by
Miller Betty Lou
Bought by
Miller John Winborn
Current Estimated Value
Purchase Details
Closed on
May 22, 2012
Sold by
Ken Lawler Builders Inc
Bought by
Jones Tara Renee and Jones Jonathan Phillip
Home Financials for this Owner
Home Financials are based on the most recent Mortgage that was taken out on this home.
Original Mortgage
$28,000
Outstanding Balance
$19,400
Interest Rate
3.9%
Mortgage Type
New Conventional
Estimated Equity
$316,260
Purchase Details
Closed on
Jan 9, 2008
Sold by
Parish Of Caddo
Bought by
Ken Lawler Builders Inc
Create a Home Valuation Report for This Property
The Home Valuation Report is an in-depth analysis detailing your home's value as well as a comparison with similar homes in the area
Home Values in the Area
Average Home Value in this Area
Purchase History
| Date | Buyer | Sale Price | Title Company |
|---|---|---|---|
| Miller John Winborn | -- | None Available | |
| Jones Tara Renee | $35,000 | None Available | |
| Ken Lawler Builders Inc | -- | None Available |
Source: Public Records
Mortgage History
| Date | Status | Borrower | Loan Amount |
|---|---|---|---|
| Open | Jones Tara Renee | $28,000 |
Source: Public Records
Tax History Compared to Growth
Tax History
| Year | Tax Paid | Tax Assessment Tax Assessment Total Assessment is a certain percentage of the fair market value that is determined by local assessors to be the total taxable value of land and additions on the property. | Land | Improvement |
|---|---|---|---|---|
| 2024 | $4,386 | $28,000 | $2,998 | $25,002 |
| 2023 | $4,217 | $26,214 | $2,855 | $23,359 |
| 2022 | $4,217 | $26,214 | $2,855 | $23,359 |
| 2021 | $4,219 | $26,214 | $2,855 | $23,359 |
| 2020 | $4,219 | $26,214 | $2,855 | $23,359 |
| 2019 | $4,144 | $25,945 | $2,855 | $23,090 |
| 2018 | $2,764 | $25,945 | $2,855 | $23,090 |
| 2017 | $4,092 | $25,945 | $2,855 | $23,090 |
| 2015 | $2,809 | $25,945 | $2,855 | $23,090 |
| 2014 | $3,948 | $25,950 | $2,860 | $23,090 |
| 2013 | -- | $2,860 | $2,860 | $0 |
Source: Public Records
Map
Nearby Homes
- 6767 Spring Valley Dr
- 6624 Evelyn Dr
- 5115 Oaklawn Park Dr
- 7109 Lakefield St
- 6568 Blanchard Lake Dr
- 6554 Blanchard Lake Dr
- 6583 Blanchard Lake Dr
- 646 Hilltop Cir
- 649 Hilltop Cir
- 636 Sandy Ridge Cir
- 7822 Mary Ann Cir
- 6564 Haswell Dr
- 313 Jo Lacey Dr
- 4930 Beechwood Hills Dr
- 4951 Beechwood Hills Dr
- 7417 Weathertop Dr
- 226 Phelps Ave
- 99 Jo Lacey Dr
- 168 Katie Cir
- 203 N Main St
- 8248 Brookington Dr
- 6827 N Club Loop
- 6827 N Club Loop
- 8308 Brookington Dr
- 6826 N Club Loop
- 6826 N Club Loop Unit 2
- 6817 N Club Loop
- 6817 N Club Loop
- 6817 N Club Loop
- 8208 Brookington Dr
- 8249 Brookington Dr
- 8229 Brookington Dr
- 8315 N Park Ln
- 6807 N Club Loop
- 8318 Brookington Dr
- 8219 Brookington Dr
- 8335 Camden Cir
- 8209 Brookington Dr
- 6917 Avondale Dr
- 8325 Camden Cir