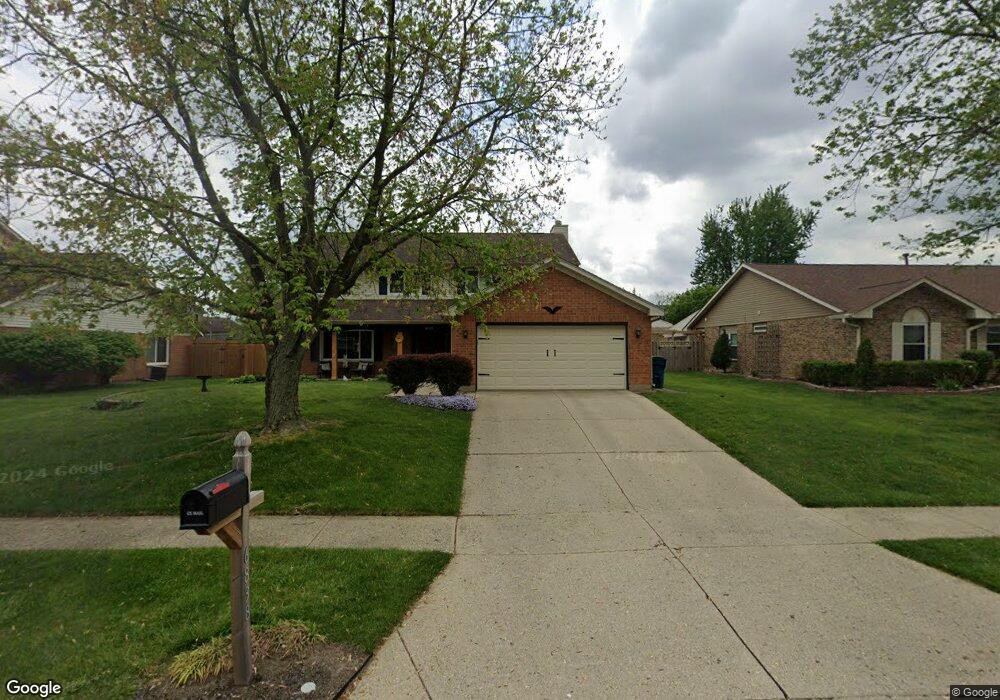
6838 Charlesgate Rd Dayton, OH 45424
Estimated Value: $304,644 - $324,000
4
Beds
3
Baths
2,238
Sq Ft
$140/Sq Ft
Est. Value
About This Home
This home is located at 6838 Charlesgate Rd, Dayton, OH 45424 and is currently estimated at $313,911, approximately $140 per square foot. 6838 Charlesgate Rd is a home located in Montgomery County with nearby schools including Wayne High School and Huber Heights Christian Academy.
Ownership History
Date
Name
Owned For
Owner Type
Purchase Details
Closed on
Nov 12, 2008
Sold by
Ward Dawn
Bought by
Ward Dawn and Kerr John
Current Estimated Value
Home Financials for this Owner
Home Financials are based on the most recent Mortgage that was taken out on this home.
Original Mortgage
$164,835
Outstanding Balance
$107,504
Interest Rate
5.95%
Mortgage Type
FHA
Estimated Equity
$206,407
Purchase Details
Closed on
Jun 24, 2005
Sold by
Ward Robert
Bought by
Ward Dawn
Purchase Details
Closed on
Oct 26, 2001
Sold by
Rainey Alaric D
Bought by
Ward Robert J and Ward Dawn L
Home Financials for this Owner
Home Financials are based on the most recent Mortgage that was taken out on this home.
Original Mortgage
$138,803
Interest Rate
6.88%
Mortgage Type
FHA
Purchase Details
Closed on
Mar 15, 1995
Sold by
Huber Investment Corporation
Bought by
Jones Michael L and Jones Bonnie S
Create a Home Valuation Report for This Property
The Home Valuation Report is an in-depth analysis detailing your home's value as well as a comparison with similar homes in the area
Home Values in the Area
Average Home Value in this Area
Purchase History
| Date | Buyer | Sale Price | Title Company |
|---|---|---|---|
| Ward Dawn | -- | Patriot Title Agency Inc | |
| Ward Dawn | -- | -- | |
| Ward Robert J | $139,900 | -- | |
| Jones Michael L | -- | -- |
Source: Public Records
Mortgage History
| Date | Status | Borrower | Loan Amount |
|---|---|---|---|
| Open | Ward Dawn | $164,835 | |
| Previous Owner | Ward Robert J | $138,803 |
Source: Public Records
Tax History Compared to Growth
Tax History
| Year | Tax Paid | Tax Assessment Tax Assessment Total Assessment is a certain percentage of the fair market value that is determined by local assessors to be the total taxable value of land and additions on the property. | Land | Improvement |
|---|---|---|---|---|
| 2024 | $4,009 | $78,230 | $15,710 | $62,520 |
| 2023 | $4,009 | $78,230 | $15,710 | $62,520 |
| 2022 | $3,749 | $57,520 | $11,550 | $45,970 |
| 2021 | $3,788 | $57,520 | $11,550 | $45,970 |
| 2020 | $3,790 | $57,520 | $11,550 | $45,970 |
| 2019 | $3,943 | $52,950 | $12,080 | $40,870 |
| 2018 | $3,957 | $52,950 | $12,080 | $40,870 |
| 2017 | $3,930 | $52,950 | $12,080 | $40,870 |
| 2016 | $3,937 | $51,710 | $10,500 | $41,210 |
| 2015 | $3,886 | $51,710 | $10,500 | $41,210 |
| 2014 | $3,886 | $51,710 | $10,500 | $41,210 |
| 2012 | -- | $49,620 | $10,500 | $39,120 |
Source: Public Records
Map
Nearby Homes
- 6938 Charlesgate Rd
- 6809 Casa Grande Ct
- 8848 Deer Hollow Dr
- 7191 Honeylocust St
- 4264 Forestedge St
- 2036 Cedar Lake Dr
- 2024 Cedar Lake Dr
- 7113 Honeylocust St
- 7185 Honeylocust St
- 1235 Gable Way
- 6991 Salon Cir Unit 4444
- The Rosewood Plan at Gables of Huber Heights - The Gables of Huber Heights
- The Gable Plan at Gables of Huber Heights - The Gables of Huber Heights
- The Cedar Plan at Gables of Huber Heights - The Gables of Huber Heights
- 6652 Loblolly Dr
- 5073 Catalpa Dr
- 8930 Century Ln
- 3290 Dry Run St
- 2020 Cedar Lake Dr
- 6334 Shull Rd
- 6848 Charlesgate Rd
- 6828 Charlesgate Rd
- 6755 Deer Ridge Dr
- 6765 Deer Ridge Dr
- 6858 Charlesgate Rd
- 6818 Charlesgate Rd
- 6745 Deer Ridge Dr
- 6837 Charlesgate Rd
- 6847 Charlesgate Rd
- 6735 Deer Ridge Dr
- 6775 Deer Ridge Dr
- 6868 Charlesgate Rd
- 6808 Charlesgate Rd
- 6827 Charlesgate Rd
- 6857 Charlesgate Rd
- 6725 Deer Ridge Dr
- 6867 Charlesgate Rd
- 6878 Charlesgate Rd
- 8721 Deer Plains Way
- 6754 Deer Ridge Dr