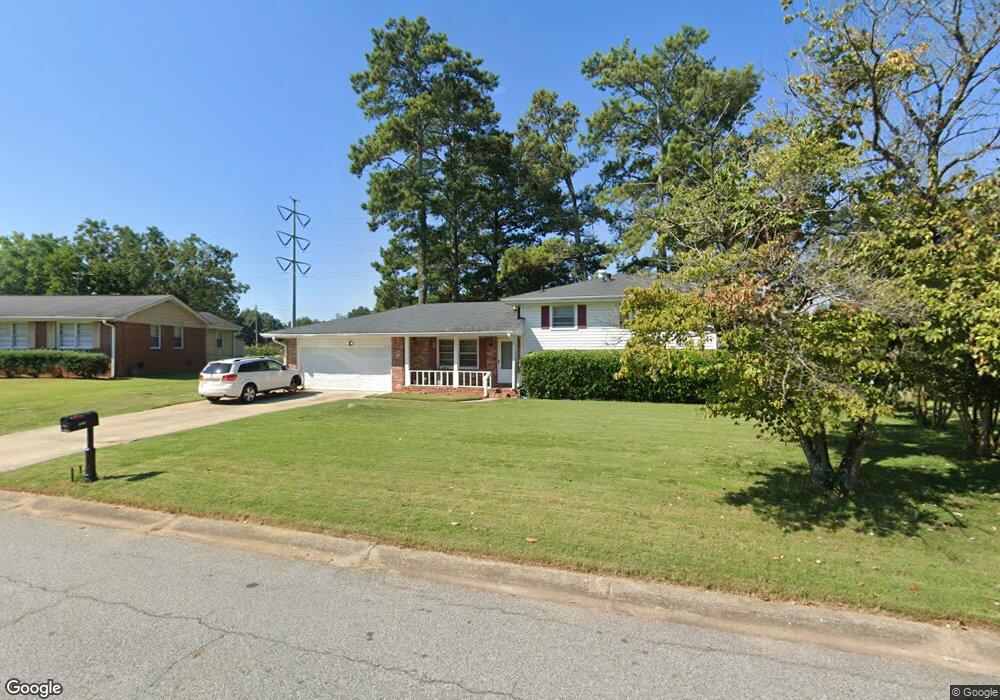
6839 Charles Dr Morrow, GA 30260
Estimated Value: $203,814 - $239,000
4
Beds
2
Baths
1,170
Sq Ft
$186/Sq Ft
Est. Value
About This Home
This home is located at 6839 Charles Dr, Morrow, GA 30260 and is currently estimated at $218,204, approximately $186 per square foot. 6839 Charles Dr is a home located in Clayton County with nearby schools including Morrow Elementary School, Morrow Middle School, and Morrow High School.
Ownership History
Date
Name
Owned For
Owner Type
Purchase Details
Closed on
Aug 6, 2018
Sold by
Smith Joseph
Bought by
Lawrence Ray A
Current Estimated Value
Home Financials for this Owner
Home Financials are based on the most recent Mortgage that was taken out on this home.
Original Mortgage
$117,012
Outstanding Balance
$100,982
Interest Rate
4.5%
Mortgage Type
New Conventional
Estimated Equity
$117,222
Purchase Details
Closed on
Apr 18, 2003
Sold by
Feabry Ricky
Bought by
Smith Joseph
Purchase Details
Closed on
Mar 27, 2001
Sold by
Feabry Ricky and Feabry Evelyn H
Bought by
Feabry Ricky
Home Financials for this Owner
Home Financials are based on the most recent Mortgage that was taken out on this home.
Original Mortgage
$117,594
Interest Rate
6.98%
Mortgage Type
FHA
Purchase Details
Closed on
Mar 23, 2000
Sold by
Wheeler Dennis G and Wheeler Nola F
Bought by
Feaby Rich
Home Financials for this Owner
Home Financials are based on the most recent Mortgage that was taken out on this home.
Original Mortgage
$118,335
Interest Rate
8.38%
Mortgage Type
FHA
Purchase Details
Closed on
Oct 26, 1995
Sold by
Mohan Rajalakshmi
Bought by
Wheeler Dennis Nola
Create a Home Valuation Report for This Property
The Home Valuation Report is an in-depth analysis detailing your home's value as well as a comparison with similar homes in the area
Home Values in the Area
Average Home Value in this Area
Purchase History
| Date | Buyer | Sale Price | Title Company |
|---|---|---|---|
| Lawrence Ray A | $115,000 | -- | |
| Smith Joseph | $2,000 | -- | |
| Feabry Ricky | -- | -- | |
| Feaby Rich | $119,900 | -- | |
| Wheeler Dennis Nola | $79,900 | -- |
Source: Public Records
Mortgage History
| Date | Status | Borrower | Loan Amount |
|---|---|---|---|
| Open | Lawrence Ray A | $117,012 | |
| Previous Owner | Feabry Ricky | $117,594 | |
| Previous Owner | Feaby Rich | $118,335 | |
| Closed | Wheeler Dennis Nola | $0 |
Source: Public Records
Tax History
| Year | Tax Paid | Tax Assessment Tax Assessment Total Assessment is a certain percentage of the fair market value that is determined by local assessors to be the total taxable value of land and additions on the property. | Land | Improvement |
|---|---|---|---|---|
| 2025 | $2,210 | $66,800 | $8,000 | $58,800 |
| 2024 | $2,237 | $66,440 | $8,000 | $58,440 |
| 2023 | $2,172 | $60,160 | $8,000 | $52,160 |
| 2022 | $1,993 | $49,880 | $8,000 | $41,880 |
| 2021 | $1,575 | $39,000 | $8,000 | $31,000 |
| 2020 | $1,500 | $36,638 | $8,000 | $28,638 |
| 2019 | $1,503 | $36,170 | $6,400 | $29,770 |
| 2018 | $1,586 | $38,197 | $6,400 | $31,797 |
| 2017 | $1,434 | $34,371 | $6,400 | $27,971 |
| 2016 | $1,373 | $32,889 | $6,400 | $26,489 |
| 2015 | $945 | $0 | $0 | $0 |
| 2014 | $829 | $19,959 | $6,400 | $13,559 |
Source: Public Records
Map
Nearby Homes
- 0 Adamson Pkwy
- 6795 Wendy Jean Dr
- 6633 Cameron Rd
- 6614 Melandre Dr
- 0 Mt Zion Blvd Unit 7715114
- 6566 Melandre Dr
- 6532 Debbie Sue Ln
- 6541 Debbie Sue Ln
- 6495 Revena Dr
- 6560 Maddox Rd
- 2117 Amish Ct
- 2320 Coach Way
- 6892 Maddox Rd Unit 2
- 6413 Maddox Rd
- 6418 Maddox Rd
- 7326 Leland Ln
- 2617 Terrace Pkwy
- 2571 Stratford Ln Unit 2LH
- 2613 Stratford Ln Unit 3
- 6584 Sleepy Hollow Ln
- 6829 Charles Dr
- 6847 Charles Dr
- 6852 Wendy Jean Dr
- 6819 Charles Dr
- 6842 Charles Dr
- 6855 Charles Dr
- 6828 Charles Dr
- 6880 Wendy Jean Dr
- 6854 Charles Dr
- 6809 Charles Dr
- 6846 Wendy Jean Dr
- 6818 Charles Dr
- 6867 Wendy Jean Dr
- 6861 Wendy Jean Dr
- 6835 Victoria Dr
- 6855 Wendy Jean Dr
- 6814 Darrell Ct
- 6823 Victoria Dr
- 6808 Charles Dr
- 6797 Charles Dr
Your Personal Tour Guide
Ask me questions while you tour the home.