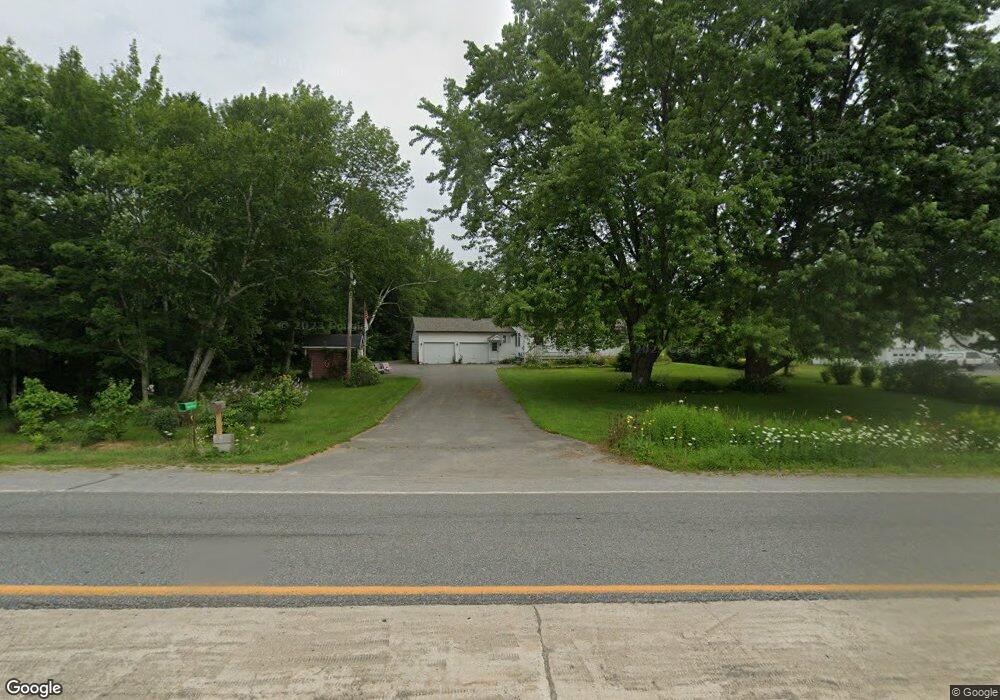
684 Main St Corinth, ME 04427
Estimated Value: $243,135 - $277,000
2
Beds
1
Bath
1,008
Sq Ft
$257/Sq Ft
Est. Value
About This Home
This home is located at 684 Main St, Corinth, ME 04427 and is currently estimated at $259,034, approximately $256 per square foot. 684 Main St is a home located in Penobscot County with nearby schools including Central Community Elementary School, Central High School, and Highview Christian Academy.
Ownership History
Date
Name
Owned For
Owner Type
Purchase Details
Closed on
Sep 9, 2025
Sold by
Harvey Donna R
Bought by
Donna R Harvey Ret and Harvey
Current Estimated Value
Purchase Details
Closed on
Jun 22, 2016
Sold by
Coleman Robert A
Bought by
Harvey Donna
Purchase Details
Closed on
Apr 12, 2005
Sold by
Libby Michael E and Libby Carolyn A
Bought by
Day Kristi M and Day Robert W
Home Financials for this Owner
Home Financials are based on the most recent Mortgage that was taken out on this home.
Original Mortgage
$110,512
Interest Rate
8%
Mortgage Type
Commercial
Create a Home Valuation Report for This Property
The Home Valuation Report is an in-depth analysis detailing your home's value as well as a comparison with similar homes in the area
Home Values in the Area
Average Home Value in this Area
Purchase History
| Date | Buyer | Sale Price | Title Company |
|---|---|---|---|
| Donna R Harvey Ret | -- | -- | |
| Harvey Donna | -- | -- | |
| Harvey Donna | -- | -- | |
| Day Kristi M | -- | -- | |
| Day Kristi M | -- | -- | |
| Day Kristi M | -- | -- |
Source: Public Records
Mortgage History
| Date | Status | Borrower | Loan Amount |
|---|---|---|---|
| Previous Owner | Day Kristi M | $110,512 | |
| Previous Owner | Day Kristi M | $27,628 |
Source: Public Records
Tax History
| Year | Tax Paid | Tax Assessment Tax Assessment Total Assessment is a certain percentage of the fair market value that is determined by local assessors to be the total taxable value of land and additions on the property. | Land | Improvement |
|---|---|---|---|---|
| 2024 | $2,248 | $166,500 | $26,700 | $139,800 |
| 2023 | $2,193 | $164,300 | $25,900 | $138,400 |
| 2022 | $2,060 | $121,200 | $18,900 | $102,300 |
| 2021 | $2,060 | $121,200 | $18,900 | $102,300 |
| 2020 | $1,939 | $121,200 | $18,900 | $102,300 |
| 2019 | $1,886 | $120,120 | $17,820 | $102,300 |
| 2018 | $1,910 | $120,120 | $17,820 | $102,300 |
| 2017 | $1,922 | $120,120 | $17,820 | $102,300 |
| 2016 | $1,483 | $115,340 | $17,820 | $97,520 |
| 2015 | $1,374 | $93,500 | $17,820 | $75,680 |
| 2014 | $1,365 | $93,500 | $17,820 | $75,680 |
| 2013 | $1,300 | $93,500 | $17,820 | $75,680 |
Source: Public Records
Map
Nearby Homes
- 98 White Schoolhouse Rd
- Lot 24-07 Tate Rd
- 465 Grant Rd
- 348 Main St
- 336 Main St
- 1156 Main St
- 296 Main St
- 562 Ledge Hill Rd
- 748 Grant Rd
- 387 Exeter Rd
- 9 Main St
- 467 Hudson Hill Rd
- 263 Mudgett Rd
- 398 Hudson Hill Rd
- M5 Lot 14 Ridge Rd
- 182 Dover Rd
- Lot 15-15 Brann Rd
- 40 Cookson
- 3-3-A Avenue Rd
- 2382 Exeter Rd
Your Personal Tour Guide
Ask me questions while you tour the home.