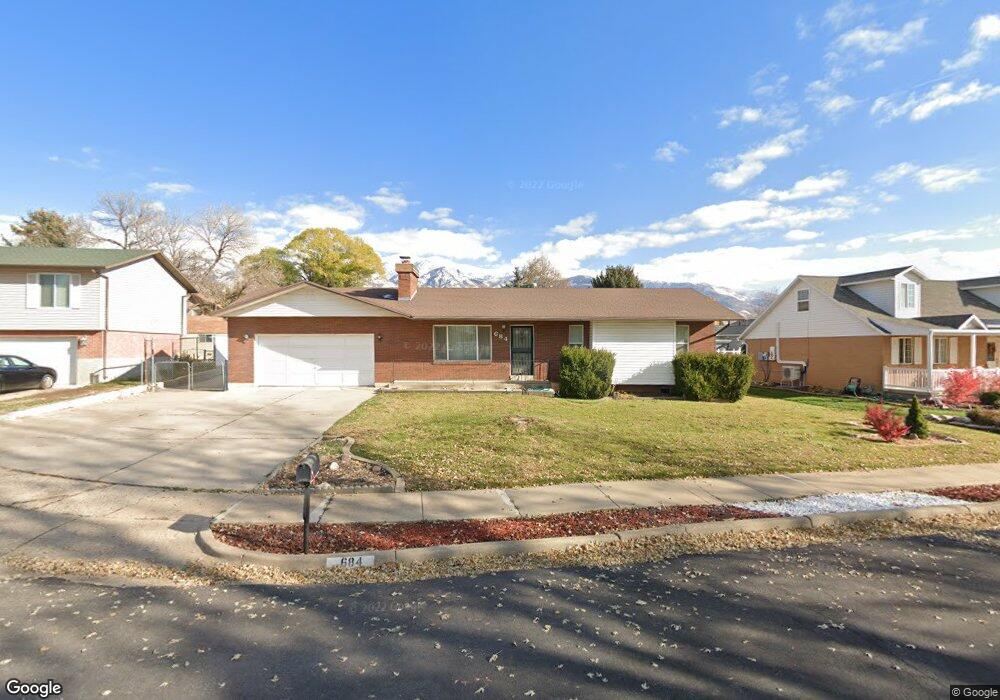
684 N Snowcreek Cir Layton, UT 84040
Estimated Value: $478,000 - $512,000
5
Beds
3
Baths
2,402
Sq Ft
$207/Sq Ft
Est. Value
About This Home
This home is located at 684 N Snowcreek Cir, Layton, UT 84040 and is currently estimated at $496,633, approximately $206 per square foot. 684 N Snowcreek Cir is a home located in Davis County with nearby schools including King Elementary School, Central Davis Junior High School, and Layton High School.
Ownership History
Date
Name
Owned For
Owner Type
Purchase Details
Closed on
Oct 23, 2023
Sold by
Evans Paul
Bought by
Ponce Shawn and Ponce Rafael H
Current Estimated Value
Home Financials for this Owner
Home Financials are based on the most recent Mortgage that was taken out on this home.
Original Mortgage
$446,758
Outstanding Balance
$438,072
Interest Rate
7.18%
Mortgage Type
FHA
Estimated Equity
$58,561
Purchase Details
Closed on
Feb 22, 2018
Sold by
Sleight Clyde T
Bought by
Evans Paul
Purchase Details
Closed on
Oct 5, 2004
Sold by
Re/Max Relocation Inc
Bought by
Sleight Clyde T
Purchase Details
Closed on
Oct 4, 2004
Sold by
Rawson Michael G and Rawson Grace T
Bought by
Re/Max Relocation Inc
Create a Home Valuation Report for This Property
The Home Valuation Report is an in-depth analysis detailing your home's value as well as a comparison with similar homes in the area
Home Values in the Area
Average Home Value in this Area
Purchase History
| Date | Buyer | Sale Price | Title Company |
|---|---|---|---|
| Ponce Shawn | -- | Stewart Title | |
| Evans Paul | -- | Vanguard Title | |
| Sleight Clyde T | -- | Founders Title Co | |
| Re/Max Relocation Inc | -- | Founders Title Co |
Source: Public Records
Mortgage History
| Date | Status | Borrower | Loan Amount |
|---|---|---|---|
| Open | Ponce Shawn | $446,758 |
Source: Public Records
Tax History Compared to Growth
Tax History
| Year | Tax Paid | Tax Assessment Tax Assessment Total Assessment is a certain percentage of the fair market value that is determined by local assessors to be the total taxable value of land and additions on the property. | Land | Improvement |
|---|---|---|---|---|
| 2025 | $2,410 | $253,000 | $121,283 | $131,717 |
| 2024 | $40 | $244,750 | $145,661 | $99,089 |
| 2023 | $0 | $424,000 | $197,635 | $226,365 |
| 2022 | $438 | $243,100 | $105,902 | $137,198 |
| 2021 | $2,146 | $324,000 | $160,998 | $163,002 |
| 2020 | $1,871 | $271,000 | $129,671 | $141,329 |
| 2019 | $1,847 | $262,000 | $115,985 | $146,015 |
| 2018 | $1,664 | $237,000 | $89,754 | $147,246 |
| 2016 | $1,590 | $116,765 | $47,353 | $69,412 |
| 2015 | $1,550 | $108,075 | $49,721 | $58,354 |
| 2014 | $1,464 | $104,400 | $49,721 | $54,679 |
| 2013 | -- | $99,396 | $22,748 | $76,648 |
Source: Public Records
Map
Nearby Homes
- 861 E 575 N
- 857 E 575 N
- 556 N Fairfield Rd Unit A2
- 556 N Fairfield Rd Unit D1
- 556 N Fairfield Rd Unit D2
- 556 N Fairfield Rd Unit A3
- 556 N Fairfield Rd Unit D3
- 556 N Fairfield Rd Unit D4
- 556 N Fairfield Rd Unit A1
- 556 N Fairfield Rd Unit A4
- 508 N Adamswood Rd
- 654 Colonial St
- 580 N Allanwood Place
- 880 E 350 N
- 794 Valeria Dr
- 479 N 1375 E
- 1503 E 530 N
- 1247 E 300 N
- 785 Sherwood Dr
- 1122 E 1250 N
- 714 N Snowcreek Cir
- 662 N Snowcreek Cir
- 707 N Adamswood Rd
- 689 N Adamswood Rd
- 722 N Snowcreek Cir
- 722 Snowcreek Dr
- 689 N Snowcreek Cir
- 646 N Snowcreek Cir
- 723 N Adamswood Rd
- 663 N Adamswood Rd
- 671 N Snowcreek Cir
- 707 N Snowcreek Cir
- 755 N Adamswood Rd
- 719 N Snowcreek Cir
- 643 N Snowcreek Cir
- 771 N Adamswood Rd
- 628 N Snowcreek Cir
- 637 N Adamswood Rd Unit 1
- 698 N Adamswood Rd
- 672 N Adamswood Rd