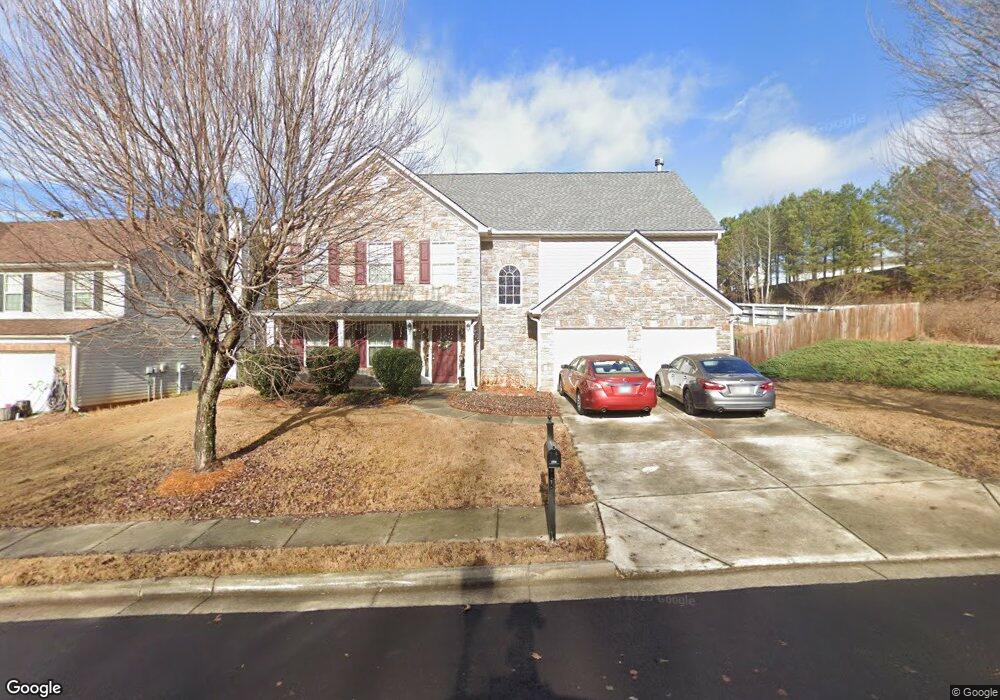
684 Roxholly Walk Unit 3 Buford, GA 30518
Estimated Value: $474,198 - $496,000
5
Beds
3
Baths
2,741
Sq Ft
$176/Sq Ft
Est. Value
About This Home
This home is located at 684 Roxholly Walk Unit 3, Buford, GA 30518 and is currently estimated at $483,300, approximately $176 per square foot. 684 Roxholly Walk Unit 3 is a home located in Gwinnett County with nearby schools including Sugar Hill Elementary School, Lanier Middle School, and Lanier High School.
Ownership History
Date
Name
Owned For
Owner Type
Purchase Details
Closed on
Nov 18, 2021
Sold by
Jimenez Jose D Gonzalez Estate
Bought by
Gonzalez Adrian and Gonzalez Maria C
Current Estimated Value
Home Financials for this Owner
Home Financials are based on the most recent Mortgage that was taken out on this home.
Original Mortgage
$285,000
Outstanding Balance
$259,809
Interest Rate
3.09%
Mortgage Type
New Conventional
Estimated Equity
$223,492
Purchase Details
Closed on
Feb 26, 2007
Sold by
Gonzalez Jose J
Bought by
Gonzalez Jose J and Gonzalez Adelina D
Home Financials for this Owner
Home Financials are based on the most recent Mortgage that was taken out on this home.
Original Mortgage
$199,900
Interest Rate
6.16%
Mortgage Type
New Conventional
Purchase Details
Closed on
Dec 21, 2005
Sold by
Oh Yong S
Bought by
Oh Yong S and Oh Seung H
Home Financials for this Owner
Home Financials are based on the most recent Mortgage that was taken out on this home.
Original Mortgage
$165,900
Interest Rate
5.87%
Mortgage Type
New Conventional
Create a Home Valuation Report for This Property
The Home Valuation Report is an in-depth analysis detailing your home's value as well as a comparison with similar homes in the area
Home Values in the Area
Average Home Value in this Area
Purchase History
| Date | Buyer | Sale Price | Title Company |
|---|---|---|---|
| Gonzalez Adrian | $370,000 | -- | |
| Gonzalez Adrian | -- | -- | |
| Gonzalez Jose J | $249,900 | -- | |
| Gonzalez Jose J | $249,900 | -- | |
| Oh Yong S | -- | -- | |
| Oh Yong S | $221,300 | -- |
Source: Public Records
Mortgage History
| Date | Status | Borrower | Loan Amount |
|---|---|---|---|
| Open | Gonzalez Adrian | $285,000 | |
| Closed | Gonzalez Adrian | $285,000 | |
| Previous Owner | Gonzalez Jose J | $199,900 | |
| Previous Owner | Oh Yong S | $165,900 |
Source: Public Records
Tax History Compared to Growth
Tax History
| Year | Tax Paid | Tax Assessment Tax Assessment Total Assessment is a certain percentage of the fair market value that is determined by local assessors to be the total taxable value of land and additions on the property. | Land | Improvement |
|---|---|---|---|---|
| 2025 | $6,199 | $196,320 | $50,000 | $146,320 |
| 2024 | $5,840 | $172,040 | $35,200 | $136,840 |
| 2023 | $5,840 | $172,040 | $35,200 | $136,840 |
| 2022 | $5,500 | $146,600 | $28,000 | $118,600 |
| 2021 | $4,591 | $119,000 | $24,000 | $95,000 |
| 2020 | $4,066 | $103,800 | $20,000 | $83,800 |
| 2019 | $1,480 | $103,800 | $20,000 | $83,800 |
| 2018 | $1,438 | $100,760 | $20,000 | $80,760 |
| 2016 | $1,344 | $91,080 | $17,360 | $73,720 |
| 2015 | $1,172 | $75,960 | $12,000 | $63,960 |
| 2014 | -- | $75,960 | $12,000 | $63,960 |
Source: Public Records
Map
Nearby Homes
- 812 Holly Meadow Dr
- 665 Roxford Ln Unit 3
- 3811 Roxfield Dr
- 3725 Roxwood Park Dr Unit 1
- 3645 Hickory Branch Trail Unit 1
- 3612 Brookefall Ct
- 3805 Roxwood Park Dr Unit 1
- 3740 Crescent Walk Ln
- 3720 Crescent Walk Ln
- 3540 Hickory Branch Trail
- 515 Morning Creek Ln
- 3941 Oak Crossing Dr
- 3720 Brookefall Landing
- 189 Rutlidge Park Ln
- 3998 Oak Crossing Dr NE
- 407 Vista Lake Dr
- 3713 Lake Edge Dr
- 3929 Two Bridge Dr
- 674 Roxholly Walk Unit 3
- 664 Roxholly Walk Unit 3
- 693 Roxholly Walk NE
- 644 Roxholly Walk
- 714 Roxholly Walk Unit 3
- 683 Roxholly Walk
- 693 Roxholly Walk Unit 3/1/
- 693 Roxholly Walk
- 634 Roxholly Walk
- 673 Roxholly Walk Unit 3
- 839 Roxholly Ln
- 724 Roxholly Walk Unit 3
- 849 Roxholly Ln
- 829 Roxholly Ln
- 723 Roxholly Walk
- 1015 Sentry Ridge Crossing
- 663 Roxholly Walk NE
- 653 Roxholly Walk Unit 3
- 663 Roxholly Walk
- 624 Roxholly Walk