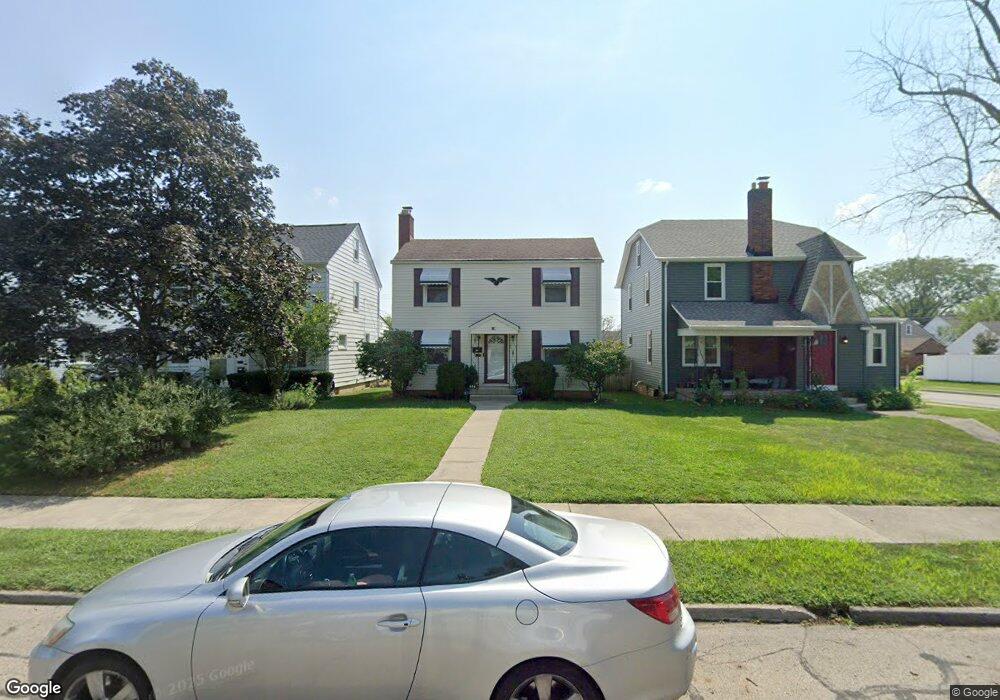
684 S Roys Ave Columbus, OH 43204
Southwest Hilltop NeighborhoodEstimated Value: $180,747 - $226,000
3
Beds
2
Baths
1,408
Sq Ft
$142/Sq Ft
Est. Value
About This Home
This home is located at 684 S Roys Ave, Columbus, OH 43204 and is currently estimated at $200,437, approximately $142 per square foot. 684 S Roys Ave is a home located in Franklin County with nearby schools including Binns Elementary School, Wedgewood Middle School, and Briggs High School.
Ownership History
Date
Name
Owned For
Owner Type
Purchase Details
Closed on
Jul 25, 2008
Sold by
Hane James A and Hane Michelle D
Bought by
Busbee Pamela J
Current Estimated Value
Home Financials for this Owner
Home Financials are based on the most recent Mortgage that was taken out on this home.
Original Mortgage
$112,106
Outstanding Balance
$73,069
Interest Rate
6.36%
Mortgage Type
FHA
Estimated Equity
$127,368
Purchase Details
Closed on
Aug 11, 2003
Sold by
Hane James A and Hane Michelle D
Bought by
Hane James A and Hane Michelle D
Purchase Details
Closed on
Apr 18, 2003
Sold by
Hane James A and Hane Michelle D
Bought by
Hane James A and Hane Michelle D
Purchase Details
Closed on
Jul 30, 2002
Sold by
Hane Lloyd G
Bought by
Hane Lloyd G and The Lloyd G Hane Revocable Liv
Purchase Details
Closed on
Oct 14, 1982
Bought by
Hane Lloyd G
Purchase Details
Closed on
Apr 1, 1978
Create a Home Valuation Report for This Property
The Home Valuation Report is an in-depth analysis detailing your home's value as well as a comparison with similar homes in the area
Home Values in the Area
Average Home Value in this Area
Purchase History
| Date | Buyer | Sale Price | Title Company |
|---|---|---|---|
| Busbee Pamela J | $113,000 | Attorney | |
| Hane James A | -- | -- | |
| Hane James A | -- | -- | |
| Hane James A | -- | -- | |
| Hane Lloyd G | -- | -- | |
| Hane Lloyd G | -- | -- | |
| -- | $36,000 | -- |
Source: Public Records
Mortgage History
| Date | Status | Borrower | Loan Amount |
|---|---|---|---|
| Open | Busbee Pamela J | $112,106 |
Source: Public Records
Tax History Compared to Growth
Tax History
| Year | Tax Paid | Tax Assessment Tax Assessment Total Assessment is a certain percentage of the fair market value that is determined by local assessors to be the total taxable value of land and additions on the property. | Land | Improvement |
|---|---|---|---|---|
| 2024 | $2,294 | $51,110 | $15,510 | $35,600 |
| 2023 | $2,277 | $51,100 | $15,505 | $35,595 |
| 2022 | $1,841 | $35,490 | $6,860 | $28,630 |
| 2021 | $1,916 | $35,490 | $6,860 | $28,630 |
| 2020 | $1,846 | $35,490 | $6,860 | $28,630 |
| 2019 | $1,777 | $29,300 | $5,710 | $23,590 |
| 2018 | $1,948 | $29,300 | $5,710 | $23,590 |
| 2017 | $2,043 | $29,300 | $5,710 | $23,590 |
| 2016 | $2,310 | $34,870 | $7,740 | $27,130 |
| 2015 | $2,097 | $34,870 | $7,740 | $27,130 |
| 2014 | $2,102 | $34,870 | $7,740 | $27,130 |
| 2013 | $1,151 | $38,710 | $8,575 | $30,135 |
Source: Public Records
Map
Nearby Homes
- 638 Binns Blvd
- 725 Binns Blvd
- 733 S Hague Ave
- 610 Salisbury Rd
- 638 Wiltshire Rd
- 690 S Hague Ave
- 814 Chestershire Rd
- 793 Binns Blvd
- 804 S Hague Ave
- 570 Wiltshire Rd
- 828 Binns Blvd
- 586 S Hague Ave
- 790 Racine Ave
- 898 Chestershire Rd
- 890 S Roys Ave
- 596 - 598 Racine Ave
- 677 S Warren Ave
- 457 Guernsey Ave
- 894 Binns Blvd
- 903 S Harris Ave
- 688 S Roys Ave
- 678 S Roys Ave
- 674 S Roys Ave
- 668 S Roys Ave
- 700 S Roys Ave
- 693 Chestershire Rd
- 687 Chestershire Rd
- 683 Chestershire Rd
- 679 S Roys Ave
- 706 S Roys Ave
- 685 S Roys Ave
- 675 S Roys Ave
- 677 Chestershire Rd
- 705 Chestershire Rd
- 669 S Roys Ave
- 656 S Roys Ave
- 710 S Roys Ave
- 673 Chestershire Rd
- 711 Chestershire Rd
- 663 S Roys Ave