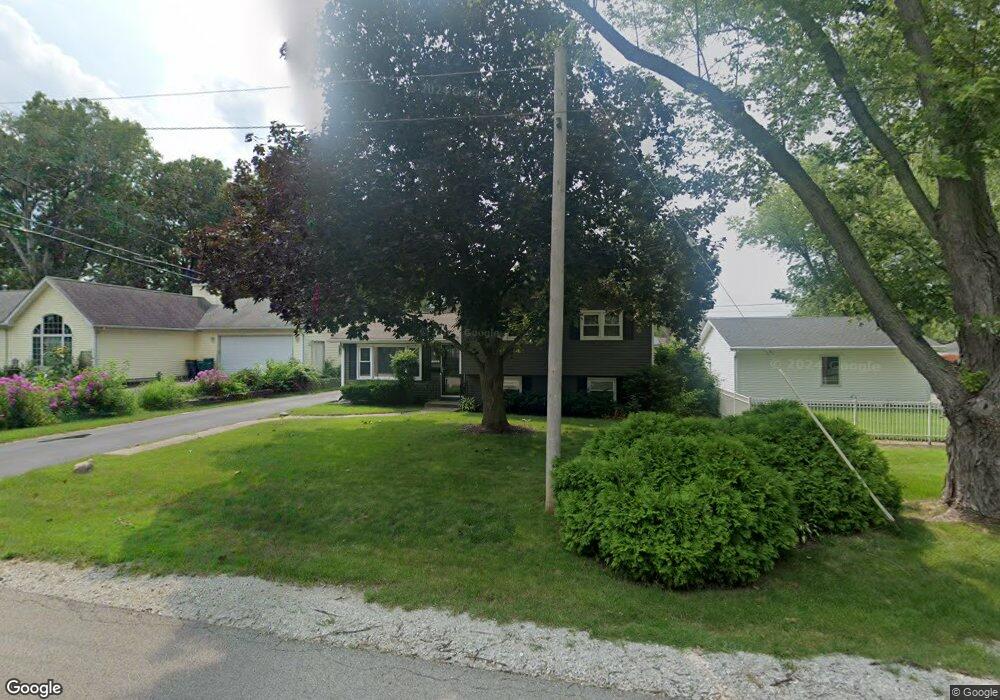
684 Stuart St Grayslake, IL 60030
Estimated Value: $286,378 - $306,000
3
Beds
2
Baths
1,056
Sq Ft
$279/Sq Ft
Est. Value
About This Home
This home is located at 684 Stuart St, Grayslake, IL 60030 and is currently estimated at $295,095, approximately $279 per square foot. 684 Stuart St is a home located in Lake County with nearby schools including Frederick School, Woodview School, and Grayslake Middle School.
Ownership History
Date
Name
Owned For
Owner Type
Purchase Details
Closed on
Jul 25, 2003
Sold by
Madison Catherine V and Brunk Catherine V
Bought by
Madison Catherine V
Current Estimated Value
Home Financials for this Owner
Home Financials are based on the most recent Mortgage that was taken out on this home.
Original Mortgage
$165,500
Outstanding Balance
$76,844
Interest Rate
6.49%
Mortgage Type
Purchase Money Mortgage
Estimated Equity
$218,251
Purchase Details
Closed on
Sep 27, 2001
Sold by
Mccoy Daniel J and Mccoy Faith V
Bought by
Brunk Catherine V
Home Financials for this Owner
Home Financials are based on the most recent Mortgage that was taken out on this home.
Original Mortgage
$164,700
Interest Rate
6.8%
Purchase Details
Closed on
Jul 8, 1999
Sold by
Steinbrook Randall H and Steinbrook Donna J
Bought by
Mccoy Daniel J and Mccoy Faith V
Home Financials for this Owner
Home Financials are based on the most recent Mortgage that was taken out on this home.
Original Mortgage
$123,300
Interest Rate
7.43%
Mortgage Type
Balloon
Create a Home Valuation Report for This Property
The Home Valuation Report is an in-depth analysis detailing your home's value as well as a comparison with similar homes in the area
Home Values in the Area
Average Home Value in this Area
Purchase History
| Date | Buyer | Sale Price | Title Company |
|---|---|---|---|
| Madison Catherine V | -- | -- | |
| Brunk Catherine V | $183,000 | -- | |
| Mccoy Daniel J | $161,000 | -- |
Source: Public Records
Mortgage History
| Date | Status | Borrower | Loan Amount |
|---|---|---|---|
| Open | Madison Catherine V | $165,500 | |
| Closed | Brunk Catherine V | $164,700 | |
| Previous Owner | Mccoy Daniel J | $123,300 |
Source: Public Records
Tax History
| Year | Tax Paid | Tax Assessment Tax Assessment Total Assessment is a certain percentage of the fair market value that is determined by local assessors to be the total taxable value of land and additions on the property. | Land | Improvement |
|---|---|---|---|---|
| 2024 | $6,911 | $79,911 | $15,858 | $64,053 |
| 2023 | $7,057 | $73,340 | $14,554 | $58,786 |
| 2022 | $7,057 | $64,839 | $8,974 | $55,865 |
| 2021 | $6,965 | $62,322 | $8,626 | $53,696 |
| 2020 | $6,951 | $59,297 | $8,207 | $51,090 |
| 2019 | $6,704 | $56,891 | $7,874 | $49,017 |
| 2018 | $6,897 | $58,821 | $19,124 | $39,697 |
| 2017 | $6,852 | $55,330 | $17,989 | $37,341 |
| 2016 | $6,553 | $51,076 | $16,606 | $34,470 |
| 2015 | $6,356 | $46,662 | $15,171 | $31,491 |
| 2014 | $6,802 | $49,241 | $12,952 | $36,289 |
| 2012 | $6,716 | $51,427 | $13,527 | $37,900 |
Source: Public Records
Map
Nearby Homes
- 75 Whispering Oaks Ln
- 21238 W Washington St
- 417 Lawrence Ave
- 367 N Lake St
- 1074 Potomac Ct
- 1121 Williamsburg Cir
- 346 Mitchell Dr
- 470 Ziegler Dr
- 349 Woodland Dr Unit 6
- 20295 W Washington St
- 545 Pheasant Ct
- 21570 W Eldor Ave
- 673 Cardinal Ct
- 34625 N Il Route 83
- 83 Keeneland Ct
- 492 Patricia Ct
- 1095 Ellsworth Dr
- 831 Amelia Ct
- 860 Amelia Ct
- 146 Westerfield Place
- 672 Stuart St
- 193 Highland Rd
- 679 Stuart St
- 673 Stuart St
- 211 Highland Rd
- 212 Bonnie Brae Ave
- 212 Bonnie Brae Ave
- 664 Stuart St
- 691 N Lake St
- 708 Stuart St
- 217 Highland Rd
- 707 Stuart St
- 701 N Lake St
- 658 Stuart St
- 667 N Lake St
- 212 Highland Rd
- 223 Highland Rd
- 714 Stuart St
- 707 N Lake St
- 201 Bonnie Brae Ave
Your Personal Tour Guide
Ask me questions while you tour the home.