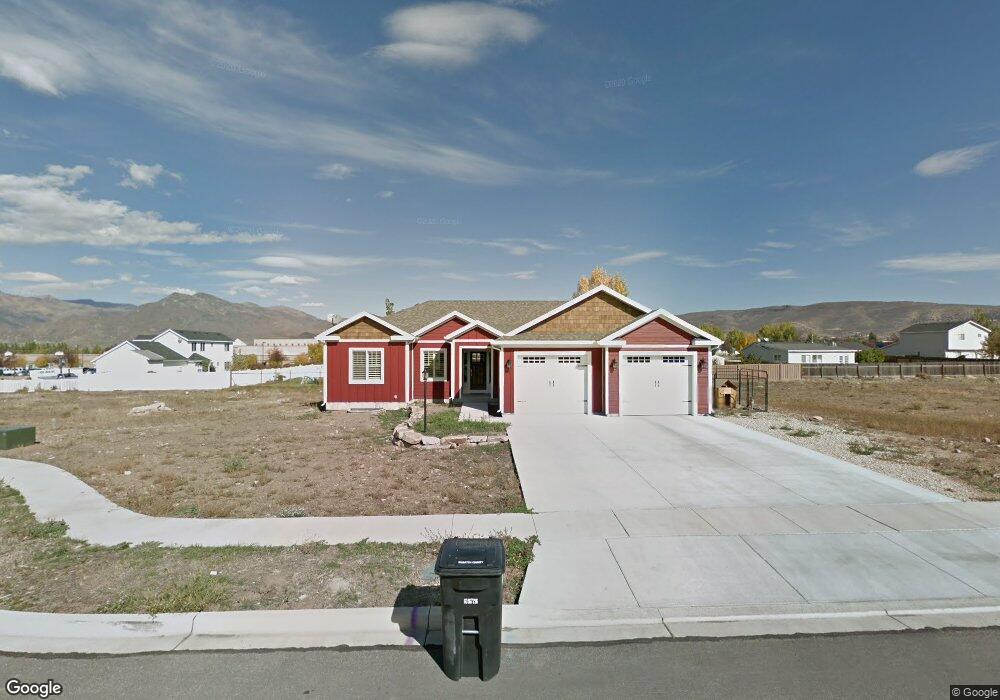
684 W 1010 S Unit 4 Heber City, UT 84032
Estimated Value: $832,000 - $928,000
--
Bed
--
Bath
1,797
Sq Ft
$487/Sq Ft
Est. Value
About This Home
This home is located at 684 W 1010 S Unit 4, Heber City, UT 84032 and is currently estimated at $874,733, approximately $486 per square foot. 684 W 1010 S Unit 4 is a home located in Wasatch County with nearby schools including Heber Valley Elementary School, Rocky Mountain Middle School, and Wasatch High School.
Ownership History
Date
Name
Owned For
Owner Type
Purchase Details
Closed on
Jun 25, 2021
Sold by
Woodland Carl J and Woodland Amberlee
Bought by
Dunivant Joel D and Dunivant Jade
Current Estimated Value
Home Financials for this Owner
Home Financials are based on the most recent Mortgage that was taken out on this home.
Original Mortgage
$777,000
Outstanding Balance
$703,477
Interest Rate
2.9%
Mortgage Type
VA
Estimated Equity
$171,256
Purchase Details
Closed on
Oct 27, 2014
Sold by
Woodland Carl L
Bought by
Woodland Carl J and Woodland Amberlee
Home Financials for this Owner
Home Financials are based on the most recent Mortgage that was taken out on this home.
Original Mortgage
$334,038
Interest Rate
4.4%
Mortgage Type
FHA
Purchase Details
Closed on
Sep 3, 2008
Sold by
Witt J Russell
Bought by
Double E Development Co
Create a Home Valuation Report for This Property
The Home Valuation Report is an in-depth analysis detailing your home's value as well as a comparison with similar homes in the area
Home Values in the Area
Average Home Value in this Area
Purchase History
| Date | Buyer | Sale Price | Title Company |
|---|---|---|---|
| Dunivant Joel D | -- | First American Heber City | |
| Woodland Carl J | -- | Title Guarantee | |
| Woodland Carl J | -- | Title Guarantee | |
| Double E Development Co | -- | Accommodation |
Source: Public Records
Mortgage History
| Date | Status | Borrower | Loan Amount |
|---|---|---|---|
| Open | Dunivant Joel D | $777,000 | |
| Previous Owner | Woodland Carl J | $334,038 |
Source: Public Records
Tax History Compared to Growth
Tax History
| Year | Tax Paid | Tax Assessment Tax Assessment Total Assessment is a certain percentage of the fair market value that is determined by local assessors to be the total taxable value of land and additions on the property. | Land | Improvement |
|---|---|---|---|---|
| 2025 | $4,193 | $824,025 | $240,000 | $584,025 |
| 2024 | $4,193 | $824,025 | $240,000 | $584,025 |
| 2023 | $4,632 | $898,500 | $125,000 | $773,500 |
| 2022 | $3,600 | $646,920 | $150,000 | $496,920 |
| 2021 | $2,547 | $363,560 | $114,000 | $249,560 |
| 2020 | $2,483 | $319,560 | $70,000 | $249,560 |
| 2019 | $2,178 | $175,758 | $0 | $0 |
| 2018 | $2,178 | $175,758 | $0 | $0 |
| 2017 | $2,190 | $175,758 | $0 | $0 |
| 2016 | $2,499 | $195,288 | $0 | $0 |
| 2015 | $2,383 | $195,288 | $0 | $0 |
| 2014 | $1,870 | $151,887 | $0 | $0 |
Source: Public Records
Map
Nearby Homes
- 665 W 1010 S
- 1187 S Lauren Ln
- 920 S 750 W
- 1470 E 1200 S
- 1076 Meadow Walk Ln
- 799 W 1250 S
- 792 School House Way Unit 3
- 806 School House Way Unit 2
- 828 School House Way Unit 1
- 375 W Meadow Walk Dr
- 585 S 600 W
- 165 W 850 S
- 1179 S Lauren Ln
- 1228 W 770 S Unit 102
- 1252 W 770 S Unit 104
- 1380 S Daniels Rd W
- Pinedale Plan at The Crossings at Lake Creek - The Crossings
- Glenwild Plan at The Crossings at Lake Creek - The Crossings
- Copperview Plan at The Crossings at Lake Creek - The Crossings
- Dahlia Plan at The Crossings at Lake Creek - The Crossings
- 684 W 1010 S
- 664 W 1010 S Unit 5
- 664 W 1010 S
- 700 W 1010 S
- 715 School House Way
- 685 W 1010 S
- 685 W 1010 S Unit 10
- 695 School House Way
- 665 W 1010 S Unit 9
- 652 W 1010 S Unit 6
- 652 W 1010 S
- 1020 S 700 W Unit 2
- 1020 S 700 W
- 700 W 1020 S
- 935 S 750 W
- 685 S 1010
- 665 School House Way
- 651 W 1010 S Unit 8
- 651 W 1010 S
- 975 S 750 W