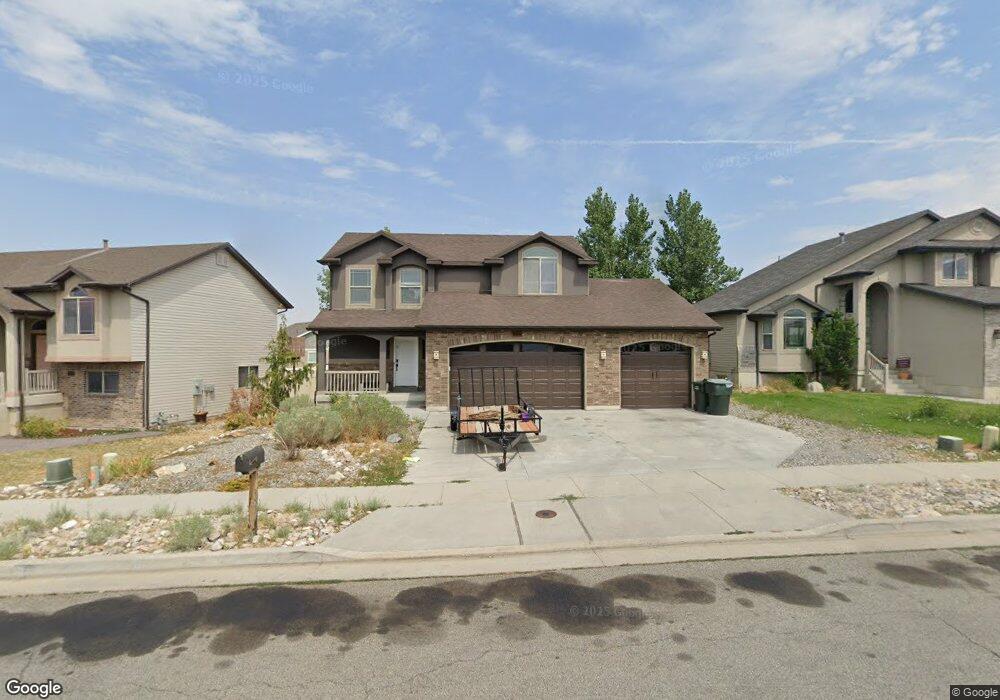
684 W 770 N Tooele, UT 84074
Estimated Value: $450,000 - $510,000
4
Beds
4
Baths
2,618
Sq Ft
$179/Sq Ft
Est. Value
About This Home
This home is located at 684 W 770 N, Tooele, UT 84074 and is currently estimated at $469,371, approximately $179 per square foot. 684 W 770 N is a home located in Tooele County with nearby schools including Northlake Elementary School, Tooele Junior High School, and Tooele High School.
Ownership History
Date
Name
Owned For
Owner Type
Purchase Details
Closed on
Aug 19, 2020
Sold by
Nguyen Hoa Tan and Nguyen Thao Ngoc
Bought by
Harris Adam
Current Estimated Value
Home Financials for this Owner
Home Financials are based on the most recent Mortgage that was taken out on this home.
Original Mortgage
$363,636
Outstanding Balance
$322,571
Interest Rate
3%
Mortgage Type
New Conventional
Estimated Equity
$146,800
Purchase Details
Closed on
Mar 26, 2020
Sold by
Rupp Stephen W and Rupp Heather Elaine
Bought by
Nguyen Thao T
Purchase Details
Closed on
Mar 20, 2020
Sold by
Nguyen Thao T
Bought by
Nguyen Hoa Tan
Purchase Details
Closed on
Apr 15, 2010
Sold by
Castle Creek Homes Llc
Bought by
Riley Heather E
Home Financials for this Owner
Home Financials are based on the most recent Mortgage that was taken out on this home.
Original Mortgage
$192,449
Interest Rate
5.9%
Mortgage Type
FHA
Create a Home Valuation Report for This Property
The Home Valuation Report is an in-depth analysis detailing your home's value as well as a comparison with similar homes in the area
Home Values in the Area
Average Home Value in this Area
Purchase History
| Date | Buyer | Sale Price | Title Company |
|---|---|---|---|
| Harris Adam | -- | Vanguard Title Ins Agcy | |
| Nguyen Thao T | -- | Integrated Title Ins Svcs | |
| Nguyen Hoa Tan | -- | Integrated Ttl Ins Services | |
| Riley Heather E | -- | Mountain View Title |
Source: Public Records
Mortgage History
| Date | Status | Borrower | Loan Amount |
|---|---|---|---|
| Open | Harris Adam | $363,636 | |
| Previous Owner | Riley Heather E | $192,449 |
Source: Public Records
Tax History Compared to Growth
Tax History
| Year | Tax Paid | Tax Assessment Tax Assessment Total Assessment is a certain percentage of the fair market value that is determined by local assessors to be the total taxable value of land and additions on the property. | Land | Improvement |
|---|---|---|---|---|
| 2025 | $2,628 | $398,564 | $100,000 | $298,564 |
| 2024 | $2,652 | $202,396 | $55,000 | $147,396 |
| 2023 | $2,652 | $224,663 | $52,383 | $172,280 |
| 2022 | $2,954 | $254,170 | $66,110 | $188,060 |
| 2021 | $2,513 | $180,812 | $20,763 | $160,049 |
| 2020 | $2,232 | $278,603 | $37,750 | $240,853 |
| 2019 | $2,176 | $267,134 | $37,750 | $229,384 |
| 2018 | $1,970 | $229,393 | $35,000 | $194,393 |
| 2017 | $1,593 | $220,136 | $35,000 | $185,136 |
| 2016 | $1,609 | $130,696 | $17,188 | $113,508 |
| 2015 | $1,609 | $116,994 | $0 | $0 |
| 2014 | $1,519 | $116,994 | $0 | $0 |
Source: Public Records
Map
Nearby Homes
- 792 N 630 W
- 831 Gleneagle Ct
- 454 W 2520 N
- 541 N Coleman St
- 1151 N 680 W Unit 8
- 459 W Sapphire Dr Unit 7034
- 1177 N 680 W Unit 3
- 1176 N 620 W Unit 221
- 429 W Sapphire Dr Unit 7038
- 412 W Sapphire Dr Unit 7009
- 409 W Sapphire Dr Unit 7040
- 515 W Caroles Way Unit 123
- 606 W Caroles Way Unit 12
- 602 W Caroles Way Unit 13
- 490 Hawthorne St
- Snowbird Plan at Vista Meadows
- Sundance Plan at Vista Meadows
- Brighton Plan at Vista Meadows
- Solitude Plan at Vista Meadows
- 372 W 600 N Unit 42