Estimated Value: $231,000 - $282,339
3
Beds
2
Baths
1,086
Sq Ft
$243/Sq Ft
Est. Value
About This Home
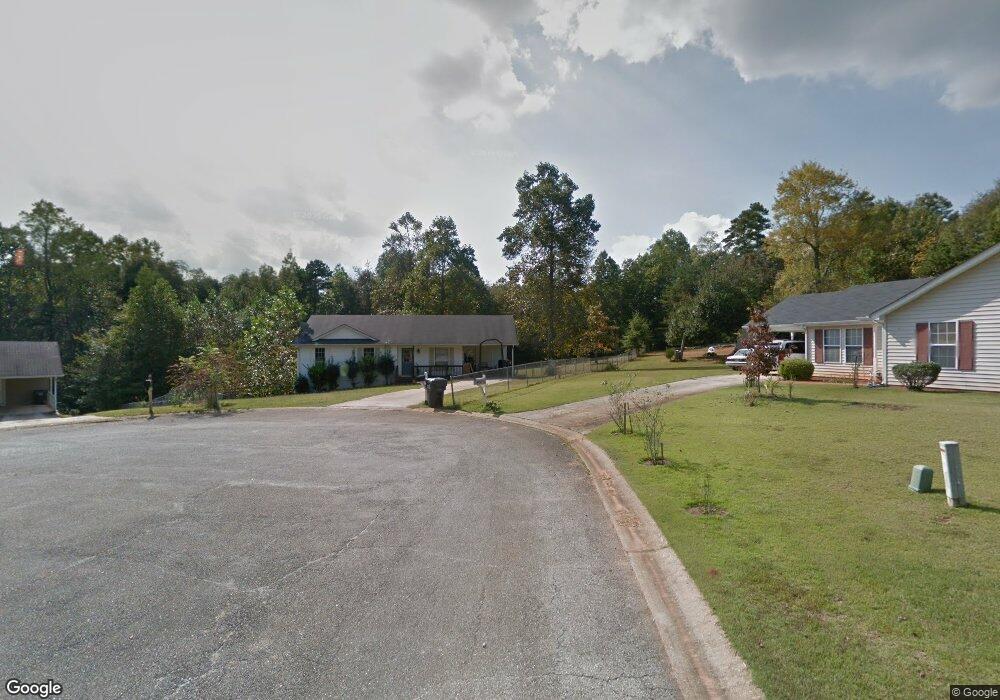
This home is located at 6840 Belton Bridge Place, Lula, GA 30554 and is currently estimated at $263,835, approximately $242 per square foot. 6840 Belton Bridge Place is a home located in Hall County with nearby schools including Lula Elementary School, East Hall Middle School, and East Hall High School.
Ownership History
Date
Name
Owned For
Owner Type
Purchase Details
Closed on
Nov 22, 2010
Sold by
Hud-Housing Of Urban Dev
Bought by
Lee Danielle
Current Estimated Value
Home Financials for this Owner
Home Financials are based on the most recent Mortgage that was taken out on this home.
Original Mortgage
$90,144
Outstanding Balance
$60,528
Interest Rate
4.62%
Mortgage Type
FHA
Estimated Equity
$203,307
Purchase Details
Closed on
Jun 2, 2009
Sold by
Wells Fargo Bk Na
Bought by
Hud-Housing Of Urban Dev
Purchase Details
Closed on
Mar 16, 1998
Sold by
Velez Debbie
Bought by
Llamas Jose L and Llamas San Juanita
Home Financials for this Owner
Home Financials are based on the most recent Mortgage that was taken out on this home.
Original Mortgage
$84,300
Interest Rate
7.01%
Mortgage Type
FHA
Purchase Details
Closed on
Jul 1, 1994
Purchase Details
Closed on
Nov 1, 1993
Create a Home Valuation Report for This Property
The Home Valuation Report is an in-depth analysis detailing your home's value as well as a comparison with similar homes in the area
Home Values in the Area
Average Home Value in this Area
Purchase History
| Date | Buyer | Sale Price | Title Company |
|---|---|---|---|
| Lee Danielle | -- | -- | |
| Hud-Housing Of Urban Dev | -- | -- | |
| Wells Fargo Bank Na | $86,413 | -- | |
| Llamas Jose L | $85,000 | -- | |
| -- | $65,500 | -- | |
| -- | $9,200 | -- |
Source: Public Records
Mortgage History
| Date | Status | Borrower | Loan Amount |
|---|---|---|---|
| Open | Lee Danielle | $90,144 | |
| Previous Owner | Llamas Jose L | $84,300 |
Source: Public Records
Tax History Compared to Growth
Tax History
| Year | Tax Paid | Tax Assessment Tax Assessment Total Assessment is a certain percentage of the fair market value that is determined by local assessors to be the total taxable value of land and additions on the property. | Land | Improvement |
|---|---|---|---|---|
| 2024 | $2,280 | $90,840 | $5,960 | $84,880 |
| 2023 | $2,281 | $90,880 | $5,960 | $84,920 |
| 2022 | $1,832 | $70,080 | $5,960 | $64,120 |
| 2021 | $1,639 | $61,520 | $5,960 | $55,560 |
| 2020 | $1,607 | $58,600 | $5,960 | $52,640 |
| 2019 | $1,266 | $45,760 | $5,960 | $39,800 |
| 2018 | $1,129 | $39,520 | $5,960 | $33,560 |
| 2017 | $1,075 | $36,715 | $4,720 | $31,995 |
| 2016 | $1,050 | $36,715 | $4,720 | $31,995 |
| 2015 | $1,058 | $36,715 | $4,720 | $31,995 |
| 2014 | $1,058 | $36,715 | $4,720 | $31,995 |
Source: Public Records
Map
Nearby Homes
- 4920 Cornelia Hwy
- 6805 Belton Bridge Place
- 6330 Pine Ridge Point
- 6668 Belton Bridge Rd
- 5451 Cool Creek Ct
- 5312 Skyland Ct
- 5107 Mountain View Pkwy
- 5341 Mountain View Pkwy
- 5375 Mountain View Pkwy
- 5163 Mountain View Pkwy
- 5214 Happy Hollow Ct
- 6455 Main St
- 0 Caudell Dr Unit 7642531
- 0 Caudell Dr Unit 10596149
- 131 Caudell Dr
- 131 Dr
- 142 Hampton St
- 133 Brookside Dr
- 6836 Belton Bridge Place
- 6839 Belton Bridge Place
- 6835 Belton Bridge Place
- 0 Belton Bridge Place Unit 7503890
- 0 Belton Bridge Place Unit 3212368
- 0 Belton Bridge Place Unit 8766018
- 0 Belton Bridge Place Unit 8268500
- 0 Belton Bridge Place Unit 8259529
- 0 Belton Bridge Place
- 6829 Belton Bridge Place
- 6828 Belton Bridge Place
- 6827 Belton Bridge Place
- 6824 Belton Bridge Place
- 6751 Belton Bridge Rd
- 6823 Belton Bridge Place
- 7465 Belton Bridge Place
- 6751 Belton Bridge Place
- 7071 Belton Bridge Place
- 6936 Belton Bridge Place
- 6818 Belton Bridge Place