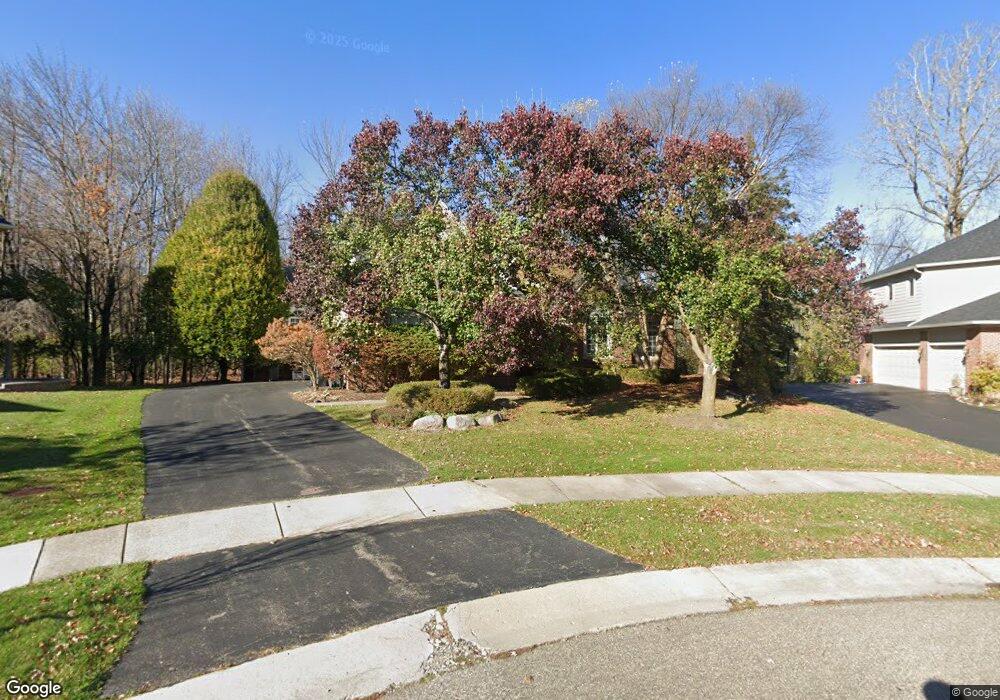
6840 Kennsway Ct West Bloomfield, MI 48322
Estimated Value: $748,393 - $936,000
3
Beds
4
Baths
3,767
Sq Ft
$216/Sq Ft
Est. Value
About This Home
This home is located at 6840 Kennsway Ct, West Bloomfield, MI 48322 and is currently estimated at $813,598, approximately $215 per square foot. 6840 Kennsway Ct is a home located in Oakland County with nearby schools including Walled Lake Central High School, Maria Montessori Center, and Novi Christian Academy.
Ownership History
Date
Name
Owned For
Owner Type
Purchase Details
Closed on
Apr 10, 2013
Sold by
Sugintas Nora
Bought by
Sugintas Nora M
Current Estimated Value
Home Financials for this Owner
Home Financials are based on the most recent Mortgage that was taken out on this home.
Original Mortgage
$175,000
Outstanding Balance
$37,029
Interest Rate
3.5%
Mortgage Type
New Conventional
Estimated Equity
$776,569
Purchase Details
Closed on
Jul 16, 2007
Sold by
Sugintas Nora M
Bought by
Sugintas Nora M and Nora M Sugintas Trust
Purchase Details
Closed on
Sep 24, 2002
Sold by
Andrew Douglas B
Bought by
Sugintas Nora M
Purchase Details
Closed on
Dec 14, 2001
Sold by
Ivanhoe-Huntley Chelsea
Bought by
Andrew Douglas B
Home Financials for this Owner
Home Financials are based on the most recent Mortgage that was taken out on this home.
Original Mortgage
$475,000
Interest Rate
7.24%
Purchase Details
Closed on
Jan 7, 1999
Sold by
Chelsea Development Ltd
Bought by
Ivanhoe - Huntley Chelsea Pk Bu
Create a Home Valuation Report for This Property
The Home Valuation Report is an in-depth analysis detailing your home's value as well as a comparison with similar homes in the area
Home Values in the Area
Average Home Value in this Area
Purchase History
| Date | Buyer | Sale Price | Title Company |
|---|---|---|---|
| Sugintas Nora M | -- | None Available | |
| Sugintas Nora M | -- | None Available | |
| Sugintas Nora M | -- | None Available | |
| Sugintas Nora M | -- | -- | |
| Andrew Douglas B | -- | -- | |
| Ivanhoe - Huntley Chelsea Pk Bu | $290,000 | -- |
Source: Public Records
Mortgage History
| Date | Status | Borrower | Loan Amount |
|---|---|---|---|
| Open | Sugintas Nora M | $175,000 | |
| Previous Owner | Andrew Douglas B | $475,000 |
Source: Public Records
Tax History Compared to Growth
Tax History
| Year | Tax Paid | Tax Assessment Tax Assessment Total Assessment is a certain percentage of the fair market value that is determined by local assessors to be the total taxable value of land and additions on the property. | Land | Improvement |
|---|---|---|---|---|
| 2024 | $5,945 | $394,520 | $0 | $0 |
| 2022 | $5,605 | $335,500 | $45,620 | $289,880 |
| 2021 | $9,249 | $327,970 | $0 | $0 |
| 2020 | $5,539 | $327,630 | $45,620 | $282,010 |
| 2018 | $9,035 | $307,220 | $45,960 | $261,260 |
| 2015 | -- | $261,610 | $0 | $0 |
| 2014 | -- | $278,210 | $0 | $0 |
| 2011 | -- | $250,670 | $0 | $0 |
Source: Public Records
Map
Nearby Homes
- 6621 Glenshaw Ct
- 6601 Pembridge Hill
- 6775 Carlyle Crossing
- 7276 Somerby
- 7288 Danbrooke Unit 125
- 7156 Sturnbridge Unit 90
- 7156 Sturnbridge
- 7418 Rafford Ln
- 6642 Carlyle Ct
- 7296 Green Farm Rd Unit 133
- 6517 Chelsea Bridge
- 31142 Applewood Ln
- 6986 Crosswell Dr
- 7329 Camelot Dr
- 6540 Ridgefield Cir Unit 204
- 7408 Westbury Blvd
- 6715 Maple Lakes Dr Unit 70
- 6693 Maple Lakes Dr Unit 62
- 6677 Maple Lakes Dr
- 31033 Evergreen Ct
- 6837 Kennsway Ct
- 6826 Kennsway Ct
- 6812 Kennsway Ct
- 6823 Kennsway Ct Unit Bldg-Unit
- 6823 Kennsway Ct
- 7006 Carlyle Crossing
- 6809 Kennsway Ct
- 7020 Carlyle Crossing
- 6992 Carlyle Crossing
- 6798 Kennsway Ct
- 6795 Kennsway Ct
- 7081 Kennowy Ct
- 7077 Kennowy Ct
- 7150 Carlyle Crossing
- 7095 Kennowy Ct
- 6964 Carlyle Crossing
- 7015 Carlyle Crossing
- 7178 Carlyle Crossing
- 7109 Kennowy Ct
- 6973 Carlyle Crossing