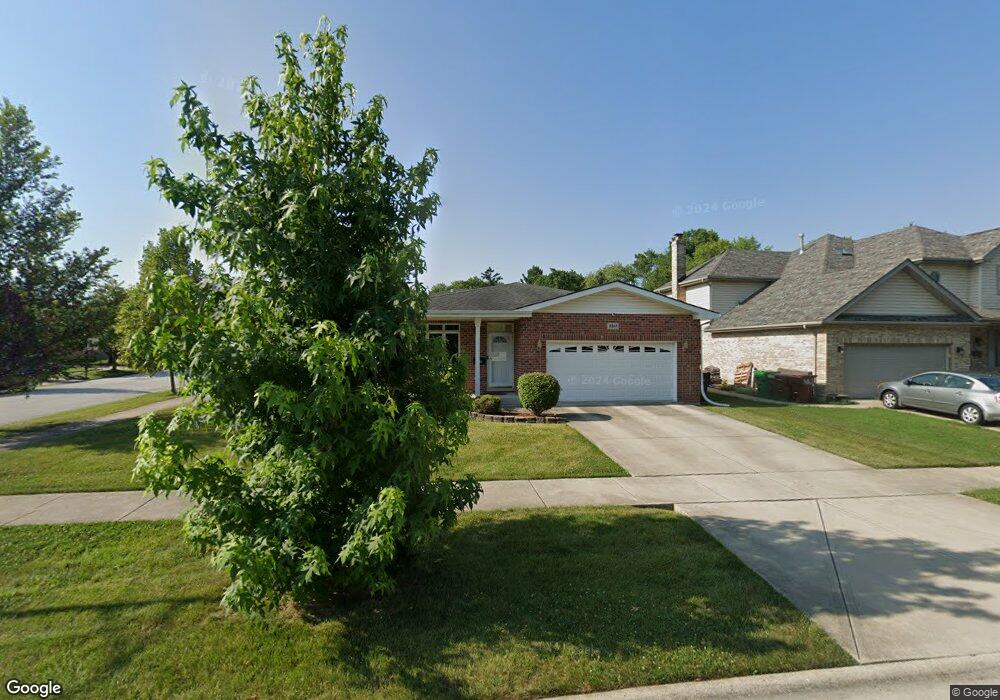
6841 172nd St Tinley Park, IL 60477
Thies NeighborhoodEstimated Value: $392,000 - $417,000
3
Beds
2
Baths
1,630
Sq Ft
$245/Sq Ft
Est. Value
About This Home
This home is located at 6841 172nd St, Tinley Park, IL 60477 and is currently estimated at $399,163, approximately $244 per square foot. 6841 172nd St is a home located in Cook County with nearby schools including Fulton Elementary School, Central Middle School, and Tinley Park High School.
Ownership History
Date
Name
Owned For
Owner Type
Purchase Details
Closed on
Dec 5, 2002
Sold by
Reda Daniel J and Reda Kimberly D
Bought by
Cinabro Mark and Cinabro Claudia
Current Estimated Value
Home Financials for this Owner
Home Financials are based on the most recent Mortgage that was taken out on this home.
Original Mortgage
$244,500
Outstanding Balance
$105,100
Interest Rate
6.25%
Estimated Equity
$294,063
Purchase Details
Closed on
May 20, 2002
Sold by
Reda Daniel J and Reda Kimberly D
Bought by
Reda Daniel J and Reda Kimberly D
Home Financials for this Owner
Home Financials are based on the most recent Mortgage that was taken out on this home.
Original Mortgage
$158,000
Interest Rate
6.82%
Mortgage Type
Stand Alone First
Purchase Details
Closed on
Jul 2, 1999
Sold by
Standard Bank & Trust Company
Bought by
Reda Daniel J
Home Financials for this Owner
Home Financials are based on the most recent Mortgage that was taken out on this home.
Original Mortgage
$150,000
Interest Rate
7.43%
Create a Home Valuation Report for This Property
The Home Valuation Report is an in-depth analysis detailing your home's value as well as a comparison with similar homes in the area
Home Values in the Area
Average Home Value in this Area
Purchase History
| Date | Buyer | Sale Price | Title Company |
|---|---|---|---|
| Cinabro Mark | $264,500 | Chicago Title Insurance Co | |
| Reda Daniel J | -- | First American Title Ins Co | |
| Reda Daniel J | $201,000 | -- |
Source: Public Records
Mortgage History
| Date | Status | Borrower | Loan Amount |
|---|---|---|---|
| Open | Cinabro Mark | $244,500 | |
| Previous Owner | Reda Daniel J | $158,000 | |
| Previous Owner | Reda Daniel J | $150,000 |
Source: Public Records
Tax History Compared to Growth
Tax History
| Year | Tax Paid | Tax Assessment Tax Assessment Total Assessment is a certain percentage of the fair market value that is determined by local assessors to be the total taxable value of land and additions on the property. | Land | Improvement |
|---|---|---|---|---|
| 2024 | $10,437 | $34,001 | $4,757 | $29,244 |
| 2023 | $8,161 | $34,001 | $4,757 | $29,244 |
| 2022 | $8,161 | $22,579 | $4,228 | $18,351 |
| 2021 | $8,115 | $22,579 | $4,228 | $18,351 |
| 2020 | $8,148 | $22,579 | $4,228 | $18,351 |
| 2019 | $9,196 | $25,270 | $3,963 | $21,307 |
| 2018 | $9,098 | $25,270 | $3,963 | $21,307 |
| 2017 | $9,183 | $25,270 | $3,963 | $21,307 |
| 2016 | $8,832 | $22,906 | $3,435 | $19,471 |
| 2015 | $8,606 | $22,906 | $3,435 | $19,471 |
| 2014 | $8,535 | $22,906 | $3,435 | $19,471 |
| 2013 | $9,160 | $26,544 | $3,435 | $23,109 |
Source: Public Records
Map
Nearby Homes
- 17223 69th Ave
- 16957 Sayre Ave
- 6666 Ravinia Dr
- 17377 71st Ave
- 6815 169th St
- 16903 Oak Park Ave
- 16724 Oak Park Ave
- 17436 71st Ave
- 6520 173rd Place
- 7218 Sandy Ln
- 7278 173rd Place
- 7124 168th St
- 17218 Ridgeland Ave Unit 3-S
- 7025 167th St Unit B
- LINCOLN Plan at Oak Ridge - Townhomes
- GARFIELD Plan at Oak Ridge - Townhomes
- 17334 Ridgeland Ave
- 16726 Westwind Ct
- 6448 175th St
- 17325 Roscommon Rd