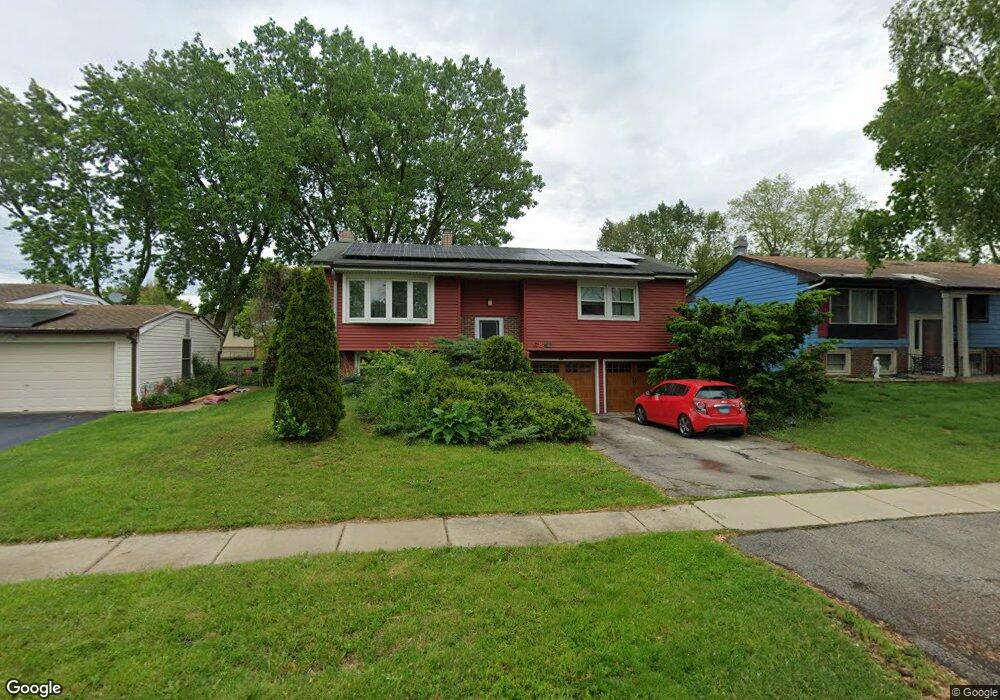
6841 Hickory St Hanover Park, IL 60133
Estimated Value: $284,000 - $336,474
3
Beds
2
Baths
1,095
Sq Ft
$282/Sq Ft
Est. Value
About This Home
This home is located at 6841 Hickory St, Hanover Park, IL 60133 and is currently estimated at $308,369, approximately $281 per square foot. 6841 Hickory St is a home located in Cook County with nearby schools including Ontarioville Elementary School, Tefft Middle School, and Bartlett High School.
Ownership History
Date
Name
Owned For
Owner Type
Purchase Details
Closed on
Nov 24, 1997
Sold by
Pelz John F and Pelz Vicki Sue Lindsey
Bought by
Himebauch Dave D and Himebauch Peggy C
Current Estimated Value
Home Financials for this Owner
Home Financials are based on the most recent Mortgage that was taken out on this home.
Original Mortgage
$128,303
Outstanding Balance
$21,392
Interest Rate
7.46%
Mortgage Type
FHA
Estimated Equity
$286,977
Purchase Details
Closed on
Mar 18, 1994
Sold by
Meyers Michael T and Meyers Marie C
Bought by
Pelz John and Lindsey Vicki Sue
Home Financials for this Owner
Home Financials are based on the most recent Mortgage that was taken out on this home.
Original Mortgage
$114,845
Interest Rate
7.27%
Mortgage Type
FHA
Create a Home Valuation Report for This Property
The Home Valuation Report is an in-depth analysis detailing your home's value as well as a comparison with similar homes in the area
Home Values in the Area
Average Home Value in this Area
Purchase History
| Date | Buyer | Sale Price | Title Company |
|---|---|---|---|
| Himebauch Dave D | $129,500 | Attorneys Natl Title Network | |
| Pelz John | $76,666 | -- |
Source: Public Records
Mortgage History
| Date | Status | Borrower | Loan Amount |
|---|---|---|---|
| Open | Himebauch Dave D | $128,303 | |
| Previous Owner | Pelz John | $114,845 |
Source: Public Records
Tax History Compared to Growth
Tax History
| Year | Tax Paid | Tax Assessment Tax Assessment Total Assessment is a certain percentage of the fair market value that is determined by local assessors to be the total taxable value of land and additions on the property. | Land | Improvement |
|---|---|---|---|---|
| 2024 | $7,193 | $24,918 | $3,894 | $21,024 |
| 2023 | $6,975 | $26,000 | $3,894 | $22,106 |
| 2022 | $6,975 | $26,000 | $3,894 | $22,106 |
| 2021 | $6,161 | $19,564 | $2,725 | $16,839 |
| 2020 | $6,197 | $19,564 | $2,725 | $16,839 |
| 2019 | $6,170 | $21,738 | $2,725 | $19,013 |
| 2018 | $5,782 | $18,798 | $2,336 | $16,462 |
| 2017 | $5,748 | $18,798 | $2,336 | $16,462 |
| 2016 | $5,724 | $18,798 | $2,336 | $16,462 |
| 2015 | $4,452 | $14,241 | $2,141 | $12,100 |
| 2014 | $4,385 | $14,241 | $2,141 | $12,100 |
| 2013 | $5,194 | $16,915 | $2,141 | $14,774 |
Source: Public Records
Map
Nearby Homes
- 6988 Plumtree Ln
- 2110 Cherry Ave
- 6551 Center Ave
- 128 Sycamore Ave
- 2040 Poplar Ave
- 804 Bussey Ct
- 1899 Redwood Ave
- 719 Lacy Ave
- 27W607 Devon Ave
- 748 Sterling Ct Unit A1
- 819 Robinson Ave
- 6641 Church St
- 6567 Church St
- 6640 Peach Tree St
- 1649 Park Ave
- 1710 Dogwood Ln
- 699 Greenfield Ct Unit B2
- 1712 Poplar Ave
- 7211 Jonquil Terrace
- 905 Miller Ave
- 6831 Hickory St
- 6851 Hickory St
- 6840 Plumtree Ln
- 6821 Hickory St
- 6830 Plumtree Ln
- 6861 Hickory St
- 6820 Plumtree Ln
- 6831 Hemlock St
- 6848 Hickory St
- 6860 Plumtree Ln
- 6811 Hickory St
- 6871 Hickory St
- 6860 Hickory St
- 6810 Plumtree Ln
- 6870 Plumtree Ln
- 6841 Hemlock St
- 6801 Hickory St
- 6881 Hickory St
- 6870 Hickory St
- 6800 Hemlock St