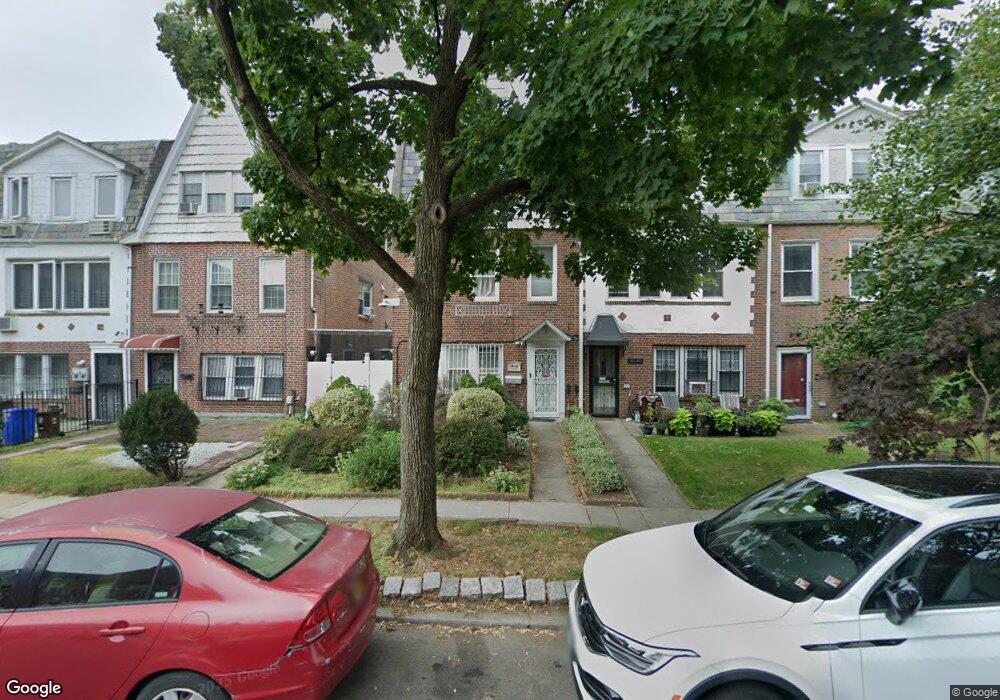
6842 Clyde St Forest Hills, NY 11375
Forest Hills NeighborhoodEstimated Value: $1,192,310 - $1,482,000
--
Bed
--
Bath
1,582
Sq Ft
$824/Sq Ft
Est. Value
About This Home
This home is located at 6842 Clyde St, Forest Hills, NY 11375 and is currently estimated at $1,304,078, approximately $824 per square foot. 6842 Clyde St is a home located in Queens County with nearby schools including Ps 144 Col Jeromus Remsen, J.H.S. 190 Russell Sage, and Queens Metropolitan High School.
Ownership History
Date
Name
Owned For
Owner Type
Purchase Details
Closed on
Nov 27, 2006
Sold by
Lai Tsui Kam and Yong Ah Kheong
Bought by
Lee Kuen Lup and Louie Kitty
Current Estimated Value
Home Financials for this Owner
Home Financials are based on the most recent Mortgage that was taken out on this home.
Original Mortgage
$417,000
Outstanding Balance
$250,557
Interest Rate
6.4%
Mortgage Type
Purchase Money Mortgage
Estimated Equity
$1,053,521
Purchase Details
Closed on
May 1, 2001
Sold by
Li Ping and Yang Yi
Bought by
Yong Ah Kheong and Lai Tsui Kam
Home Financials for this Owner
Home Financials are based on the most recent Mortgage that was taken out on this home.
Original Mortgage
$57,000
Interest Rate
7.08%
Purchase Details
Closed on
Jan 18, 2000
Sold by
Tuan Shu To and Tuan Pei Chi
Bought by
Li Ping and Yang Yi
Home Financials for this Owner
Home Financials are based on the most recent Mortgage that was taken out on this home.
Original Mortgage
$240,000
Interest Rate
7.98%
Create a Home Valuation Report for This Property
The Home Valuation Report is an in-depth analysis detailing your home's value as well as a comparison with similar homes in the area
Home Values in the Area
Average Home Value in this Area
Purchase History
| Date | Buyer | Sale Price | Title Company |
|---|---|---|---|
| Lee Kuen Lup | $730,000 | -- | |
| Yong Ah Kheong | -- | -- | |
| Li Ping | $323,000 | Fidelity National Title Ins |
Source: Public Records
Mortgage History
| Date | Status | Borrower | Loan Amount |
|---|---|---|---|
| Open | Lee Kuen Lup | $417,000 | |
| Previous Owner | Yong Ah Kheong | $57,000 | |
| Previous Owner | Li Ping | $240,000 |
Source: Public Records
Tax History Compared to Growth
Tax History
| Year | Tax Paid | Tax Assessment Tax Assessment Total Assessment is a certain percentage of the fair market value that is determined by local assessors to be the total taxable value of land and additions on the property. | Land | Improvement |
|---|---|---|---|---|
| 2025 | $8,981 | $45,899 | $10,223 | $35,676 |
| 2024 | $8,981 | $44,716 | $10,611 | $34,105 |
| 2023 | $8,549 | $42,564 | $9,489 | $33,075 |
| 2022 | $8,068 | $68,700 | $14,580 | $54,120 |
| 2021 | $8,052 | $72,540 | $14,580 | $57,960 |
| 2020 | $8,096 | $64,140 | $14,580 | $49,560 |
| 2019 | $7,795 | $62,760 | $14,580 | $48,180 |
| 2018 | $7,231 | $35,470 | $9,218 | $26,252 |
| 2017 | $6,865 | $33,679 | $8,857 | $24,822 |
| 2016 | $6,374 | $33,679 | $8,857 | $24,822 |
| 2015 | $3,832 | $31,874 | $11,062 | $20,812 |
| 2014 | $3,832 | $31,053 | $11,330 | $19,723 |
Source: Public Records
Map
Nearby Homes
- 6851 Clyde St
- 68-11 Dartmouth St
- 68-30 Burns St Unit 3D
- 68-20 Burns St Unit B2
- 68-20 Burns St Unit E1
- 68-12 Burns St Unit D4
- 6836 Groton St
- 70-25 Yellowstone Blvd Unit 10-X
- 70-25 Yellowstone Blvd Unit 2M
- 70-25 Yellowstone Blvd Unit 21Q
- 70-25 Yellowstone Blvd Unit 21R
- 70-25 Yellowstone Blvd Unit 1 Y
- 70-25 Yellowstone Blvd Unit 10Z
- 70-25 Yellowstone Blvd Unit 17Y
- 70-25 Yellowstone Blvd Unit 6B
- 70-25 Yellowstone Blvd Unit 18C
- 70-25 Yellowstone Blvd Unit 24B
- 70-25 Yellowstone Blvd Unit 18A
- 70-25 Yellowstone Blvd Unit 7U
- 70-25 Yellowstone Blvd Unit 18Q
- 68-40 Clyde St
- 6840 Clyde St
- 6844 Clyde St
- 6838 Clyde St
- 6846 Clyde St
- 6846 Clyde St
- 6846 Clyde St Unit 1/F
- 6846 Clyde St Unit 2
- 68-34 Clyde St
- 6836 Clyde St
- 6848 Clyde St
- 6848 Clyde St Unit 2,3 Fl
- 6848 Clyde St Unit 1st Fl
- 6848 Clyde St
- 6834 Clyde St
- 6850 Clyde St
- 6850 Clyde St Unit 3rd Fl
- 6850 Clyde St Unit 1st Fl
- 6850 Clyde St Unit 1FL
- 6852 Clyde St