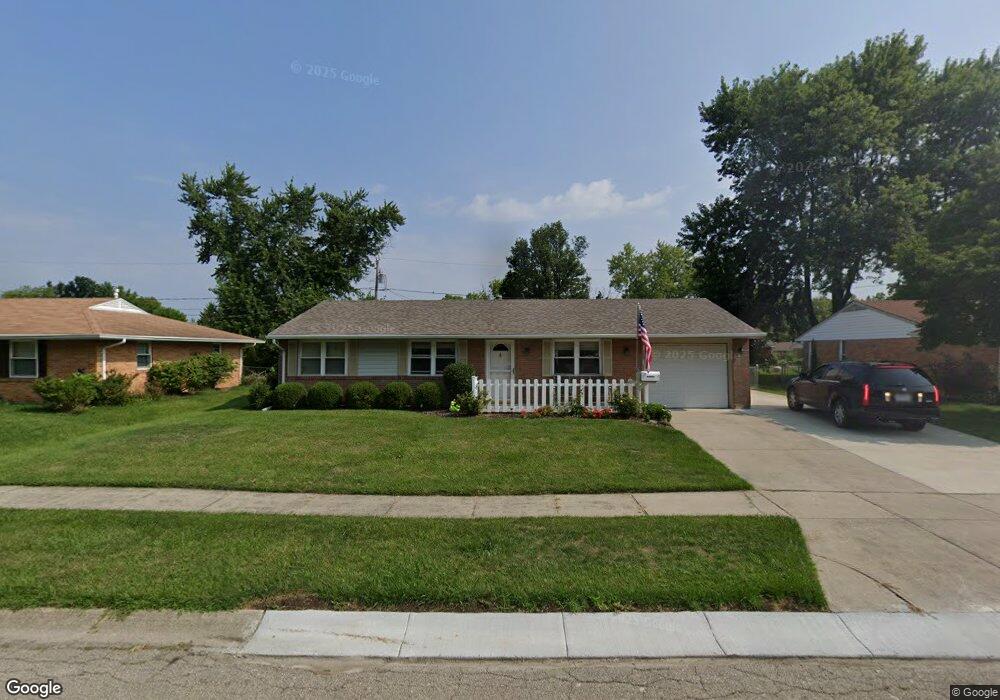
6843 Pablo Dr Dayton, OH 45424
Estimated Value: $174,326 - $198,000
3
Beds
1
Bath
988
Sq Ft
$185/Sq Ft
Est. Value
About This Home
This home is located at 6843 Pablo Dr, Dayton, OH 45424 and is currently estimated at $182,832, approximately $185 per square foot. 6843 Pablo Dr is a home located in Montgomery County with nearby schools including Wayne High School and Huber Heights Christian Academy.
Ownership History
Date
Name
Owned For
Owner Type
Purchase Details
Closed on
Jul 28, 2005
Sold by
Stewart Justin D and Childers Jennifer M
Bought by
Thornhill Dennis L and Thornhill Sharon L
Current Estimated Value
Home Financials for this Owner
Home Financials are based on the most recent Mortgage that was taken out on this home.
Original Mortgage
$95,965
Outstanding Balance
$50,574
Interest Rate
5.71%
Mortgage Type
VA
Estimated Equity
$132,258
Purchase Details
Closed on
Jun 11, 2001
Sold by
Taylor Charles A and Taylor Kasie L
Bought by
Stewart Justin D and Childers Jennifer M
Home Financials for this Owner
Home Financials are based on the most recent Mortgage that was taken out on this home.
Original Mortgage
$89,092
Interest Rate
7.16%
Mortgage Type
FHA
Purchase Details
Closed on
Feb 18, 1999
Sold by
Allen Gerald J and Allen Joni L
Bought by
Taylor Charles A and Taylor Kasie L
Home Financials for this Owner
Home Financials are based on the most recent Mortgage that was taken out on this home.
Original Mortgage
$67,800
Interest Rate
6.88%
Create a Home Valuation Report for This Property
The Home Valuation Report is an in-depth analysis detailing your home's value as well as a comparison with similar homes in the area
Home Values in the Area
Average Home Value in this Area
Purchase History
| Date | Buyer | Sale Price | Title Company |
|---|---|---|---|
| Thornhill Dennis L | $92,900 | Midwest Title Company | |
| Stewart Justin D | $89,900 | -- | |
| Taylor Charles A | $69,900 | -- |
Source: Public Records
Mortgage History
| Date | Status | Borrower | Loan Amount |
|---|---|---|---|
| Open | Thornhill Dennis L | $95,965 | |
| Closed | Stewart Justin D | $89,092 | |
| Previous Owner | Taylor Charles A | $67,800 |
Source: Public Records
Tax History Compared to Growth
Tax History
| Year | Tax Paid | Tax Assessment Tax Assessment Total Assessment is a certain percentage of the fair market value that is determined by local assessors to be the total taxable value of land and additions on the property. | Land | Improvement |
|---|---|---|---|---|
| 2024 | $1,735 | $42,440 | $10,150 | $32,290 |
| 2023 | $1,735 | $42,440 | $10,150 | $32,290 |
| 2022 | $1,350 | $29,240 | $7,000 | $22,240 |
| 2021 | $1,383 | $29,240 | $7,000 | $22,240 |
| 2020 | $1,384 | $29,240 | $7,000 | $22,240 |
| 2019 | $1,288 | $25,570 | $7,000 | $18,570 |
| 2018 | $1,293 | $25,570 | $7,000 | $18,570 |
| 2017 | $1,284 | $25,570 | $7,000 | $18,570 |
| 2016 | $1,170 | $23,640 | $7,000 | $16,640 |
| 2015 | $1,155 | $23,640 | $7,000 | $16,640 |
| 2014 | $1,155 | $23,640 | $7,000 | $16,640 |
| 2012 | -- | $26,250 | $8,750 | $17,500 |
Source: Public Records
Map
Nearby Homes
- 7741 Shalamar Dr
- 6681 Spokane Dr
- 6701 Springport Way
- 7660 Stonecrest Dr
- 7611 Shepherdess Dr
- 7211 Stonehurst Dr
- 7221 Serpentine Dr
- 8282 Briar Ridge Ct
- 6652 Loblolly Dr
- 7011 Safari Dr
- 6960 Serene Place
- 7866 Harshmanville Rd
- 7854 Harshmanville Rd
- 6605 Highbury Rd
- 7833 Harshmanville Rd
- 7061 Rio Vista Ct
- 6811 Highbury Rd
- 7371 Damascus Dr
- 6334 Shull Rd
- 6447 Highbury Rd
- 6829 Pablo Dr
- 6857 Pablo Dr
- 6850 Stonehurst Dr
- 6840 Stonehurst Dr
- 6860 Stonehurst Dr
- 6871 Pablo Dr
- 6815 Pablo Dr
- 6842 Pablo Dr
- 6856 Pablo Dr
- 6870 Stonehurst Dr
- 6820 Stonehurst Dr
- 6870 Pablo Dr
- 6814 Pablo Dr
- 6801 Pablo Dr
- 6887 Pablo Dr
- 6800 Stonehurst Dr
- 6880 Stonehurst Dr
- 7827 Sebring Dr
- 6800 Pablo Dr
- 6886 Pablo Dr