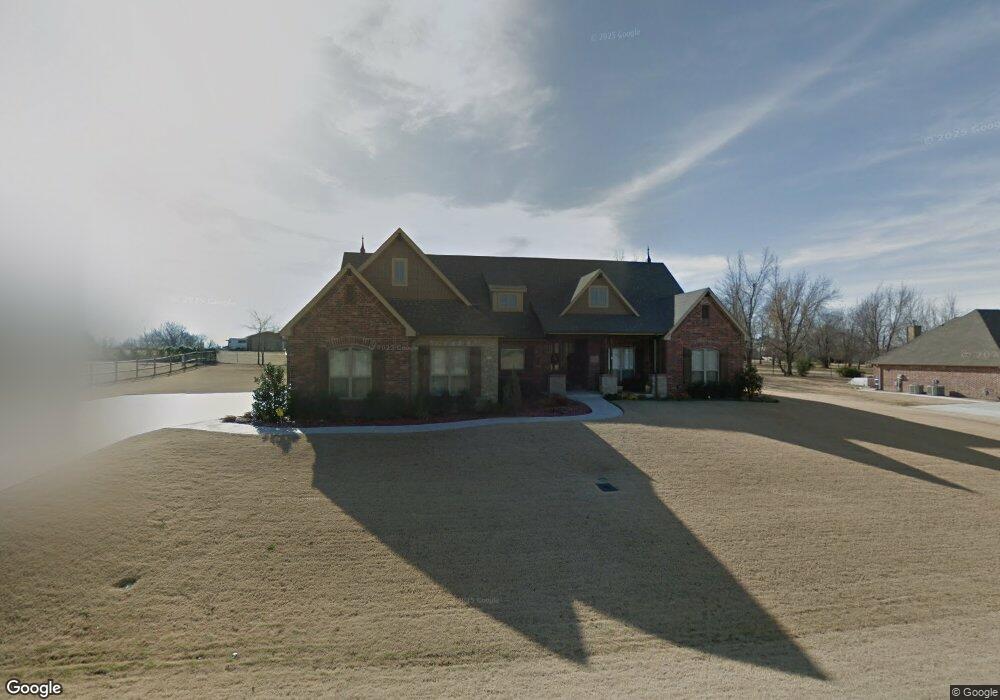
6846 E 81st St N Owasso, OK 74055
Estimated Value: $459,121 - $567,000
Studio
1
Bath
2,590
Sq Ft
$188/Sq Ft
Est. Value
About This Home
This home is located at 6846 E 81st St N, Owasso, OK 74055 and is currently estimated at $487,530, approximately $188 per square foot. 6846 E 81st St N is a home with nearby schools including Barnes Elementary School, Owasso 6th Grade Center, and Owasso 7th Grade Center.
Ownership History
Date
Name
Owned For
Owner Type
Purchase Details
Closed on
Jul 29, 2020
Sold by
Watson Anderson Brady and Watson Rebecca Jean
Bought by
Watson Anderson Brady and Watson Rebecca Jean
Current Estimated Value
Home Financials for this Owner
Home Financials are based on the most recent Mortgage that was taken out on this home.
Original Mortgage
$142,000
Outstanding Balance
$98,637
Interest Rate
3%
Mortgage Type
New Conventional
Estimated Equity
$388,893
Purchase Details
Closed on
Dec 18, 2018
Sold by
Watson A B and Watson Rebecca J
Bought by
Watson Anderson Brady and Watson Rebecca Jean
Purchase Details
Closed on
Oct 21, 2013
Sold by
Smalygo Properties Inc
Bought by
Watson A B and Watson Rebecca J
Home Financials for this Owner
Home Financials are based on the most recent Mortgage that was taken out on this home.
Original Mortgage
$155,050
Interest Rate
4.56%
Mortgage Type
New Conventional
Create a Home Valuation Report for This Property
The Home Valuation Report is an in-depth analysis detailing your home's value as well as a comparison with similar homes in the area
Home Values in the Area
Average Home Value in this Area
Purchase History
| Date | Buyer | Sale Price | Title Company |
|---|---|---|---|
| Watson Anderson Brady | -- | Allegiance Title & Escrow | |
| Watson Anderson Brady | -- | Allegiance Title & Escrow | |
| Watson Anderson Brady | -- | None Available | |
| Watson A B | $315,500 | Investors Title & Escow Co |
Source: Public Records
Mortgage History
| Date | Status | Borrower | Loan Amount |
|---|---|---|---|
| Open | Watson Anderson Brady | $142,000 | |
| Closed | Watson A B | $155,050 |
Source: Public Records
Tax History
| Year | Tax Paid | Tax Assessment Tax Assessment Total Assessment is a certain percentage of the fair market value that is determined by local assessors to be the total taxable value of land and additions on the property. | Land | Improvement |
|---|---|---|---|---|
| 2025 | $4,289 | $38,061 | $3,555 | $34,506 |
| 2024 | $3,898 | $36,923 | $3,675 | $33,248 |
| 2023 | $3,898 | $36,819 | $3,687 | $33,132 |
| 2022 | $3,949 | $34,746 | $4,384 | $30,362 |
| 2021 | $3,792 | $33,705 | $4,807 | $28,898 |
| 2020 | $3,787 | $33,705 | $4,807 | $28,898 |
| 2019 | $3,770 | $33,705 | $4,807 | $28,898 |
| 2018 | $3,652 | $33,705 | $4,807 | $28,898 |
| 2017 | $3,668 | $34,705 | $4,950 | $29,755 |
| 2016 | $3,671 | $34,705 | $4,950 | $29,755 |
| 2015 | $3,693 | $34,705 | $4,950 | $29,755 |
| 2014 | $3,723 | $34,705 | $4,950 | $29,755 |
Source: Public Records
Map
Nearby Homes
- 8136 N 68th East Place
- 7406 E 83rd Place N
- 7414 E 83rd St N
- 8432 N 68th East Ave
- 7500 E 83rd St N
- 7507 E 82nd St N
- 8350 N 72nd East Ave
- 8434 N 76th East Ave
- 8434 N 77th East Ave
- 7130 E 86th Place N
- 8708 N 73rd East Place
- 6708 E 88th St N
- 7403 E 87th St N
- 7408 E 87th Place N
- 7106 E 89th St N
- 6317 E 88th St N
- 8836 N 73rd East Place
- 7402 E 89th St N
- 7303 E 89th St N
- 7935 E 86th St N
- 6832 E 81st St N
- 6908 E 81st St N
- 8108 N 69th East Ave
- 6948 E 81st St N
- 8109 N 69th East Ave
- 6933 N 69th East Ave
- 6818 E 81st St N
- 6705 E 80th St N
- 6814 E 80th St N
- 8120 N 69th East Ave
- 8125 N 69th East Ave
- 6961 E 81st St N
- 8111 N 68th East Place
- 8111 N 68th Place E
- 6806 E 81st St N
- 6988 E 81st St N
- 8127 N 68th East Place
- 6900 E 80th St N
- 8134 N 70th East Ave
- 8215 N 68th East Place
Your Personal Tour Guide
Ask me questions while you tour the home.