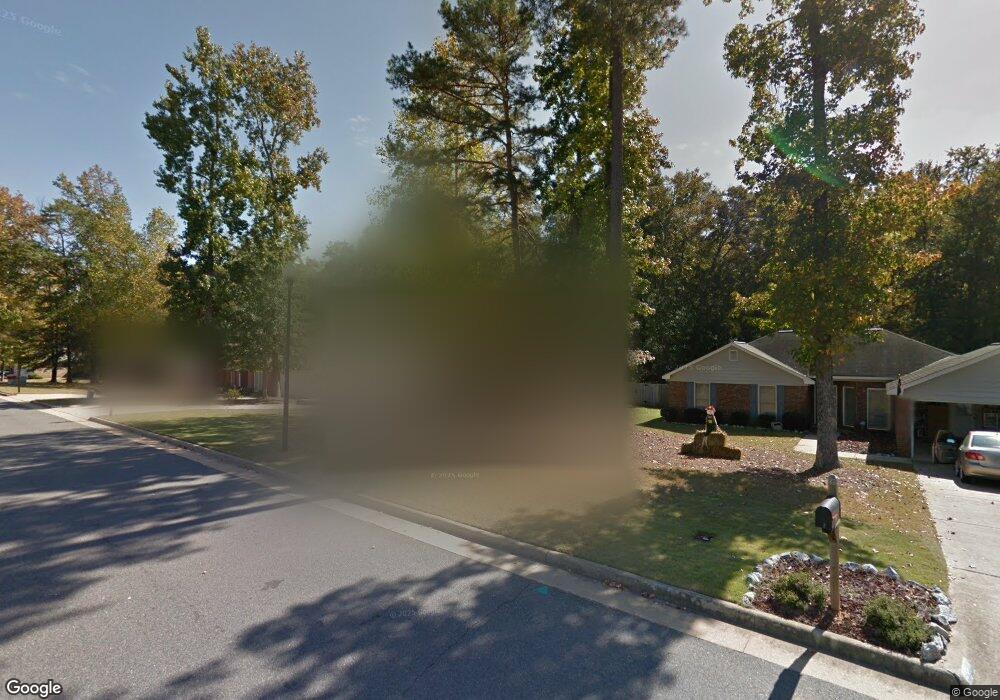
6848 Flatstone Ct Columbus, GA 31909
Midland NeighborhoodEstimated Value: $261,000 - $288,000
3
Beds
2
Baths
1,618
Sq Ft
$168/Sq Ft
Est. Value
About This Home
This home is located at 6848 Flatstone Ct, Columbus, GA 31909 and is currently estimated at $271,617, approximately $167 per square foot. 6848 Flatstone Ct is a home located in Muscogee County with nearby schools including Midland Academy, Midland Middle School, and Shaw High School.
Ownership History
Date
Name
Owned For
Owner Type
Purchase Details
Closed on
May 15, 2020
Sold by
Denes Garbiel E
Bought by
Mullins Jennifer
Current Estimated Value
Home Financials for this Owner
Home Financials are based on the most recent Mortgage that was taken out on this home.
Original Mortgage
$182,139
Outstanding Balance
$161,248
Interest Rate
3.25%
Mortgage Type
FHA
Estimated Equity
$110,369
Purchase Details
Closed on
Feb 16, 2017
Sold by
Paluso Jeffrey A
Bought by
Denes Sara C and Denes Garbiel E
Home Financials for this Owner
Home Financials are based on the most recent Mortgage that was taken out on this home.
Original Mortgage
$152,950
Interest Rate
4.09%
Mortgage Type
New Conventional
Purchase Details
Closed on
Apr 27, 2012
Sold by
Wigley Robert S
Bought by
Paluso Jeffrey A
Home Financials for this Owner
Home Financials are based on the most recent Mortgage that was taken out on this home.
Original Mortgage
$171,612
Interest Rate
4.01%
Mortgage Type
VA
Create a Home Valuation Report for This Property
The Home Valuation Report is an in-depth analysis detailing your home's value as well as a comparison with similar homes in the area
Home Values in the Area
Average Home Value in this Area
Purchase History
| Date | Buyer | Sale Price | Title Company |
|---|---|---|---|
| Mullins Jennifer | -- | -- | |
| Denes Sara C | $161,000 | -- | |
| Paluso Jeffrey A | $168,000 | -- |
Source: Public Records
Mortgage History
| Date | Status | Borrower | Loan Amount |
|---|---|---|---|
| Open | Mullins Jennifer | $182,139 | |
| Previous Owner | Denes Sara C | $152,950 | |
| Previous Owner | Paluso Jeffrey A | $171,612 |
Source: Public Records
Tax History Compared to Growth
Tax History
| Year | Tax Paid | Tax Assessment Tax Assessment Total Assessment is a certain percentage of the fair market value that is determined by local assessors to be the total taxable value of land and additions on the property. | Land | Improvement |
|---|---|---|---|---|
| 2025 | $2,301 | $90,240 | $12,736 | $77,504 |
| 2024 | $2,300 | $90,240 | $12,736 | $77,504 |
| 2023 | $1,620 | $90,240 | $12,736 | $77,504 |
| 2022 | $2,398 | $69,932 | $12,736 | $57,196 |
| 2021 | $2,391 | $71,960 | $12,736 | $59,224 |
| 2020 | $2,706 | $66,264 | $12,736 | $53,528 |
| 2019 | $2,715 | $66,264 | $12,736 | $53,528 |
| 2018 | $2,639 | $64,400 | $12,160 | $52,240 |
| 2017 | $2,767 | $67,320 | $12,736 | $54,584 |
| 2016 | $2,772 | $67,200 | $10,400 | $56,800 |
| 2015 | $2,775 | $67,200 | $10,400 | $56,800 |
| 2014 | $2,779 | $67,200 | $10,400 | $56,800 |
| 2013 | -- | $67,200 | $10,400 | $56,800 |
Source: Public Records
Map
Nearby Homes
- 7389 Sorrel Ct
- 8095 Santee Ct
- 6055 Townes Way
- 6036 Townes Way
- 8042 Sonoma Pointe Dr
- 7076 Stoneybrook Dr
- 7056 Stoneybrook Dr
- 6454 Patriot Dr
- 7020 Stoneridge Cir
- 6834 Beaver Trail
- 5135 Midland Trace
- 8051 Chapel Lake Dr
- 5110 Midland Trc
- 5110 Midland Trace
- 7101 Cross Tie Dr
- 6321 Milgen Rd Unit 3
- 6544 Mink Dr
- 7168 Pinewood Ct
- 6528 Yellow Stone Ct
- 5 Mink Ct
- 6842 Flatstone Ct
- 6854 Flatstone Ct
- 6836 Flatstone Ct
- 6860 Flatstone Ct
- 6849 Flatstone Ct
- 6843 Flatstone Ct
- 6830 Flatstone Ct
- 6866 Flatstone Ct
- 6855 Flatstone Ct
- 6837 Flatstone Ct
- 6831 Flatstone Ct
- 6861 Flatstone Ct
- 6824 Flatstone Ct
- 6433 Warm Springs Rd
- 6872 Flatstone Ct
- 5032 Stone Park Dr
- 6825 Flatstone Ct
- 5036 Stone Park Dr
- 5028 Stone Park Dr
- 6867 Flatstone Ct