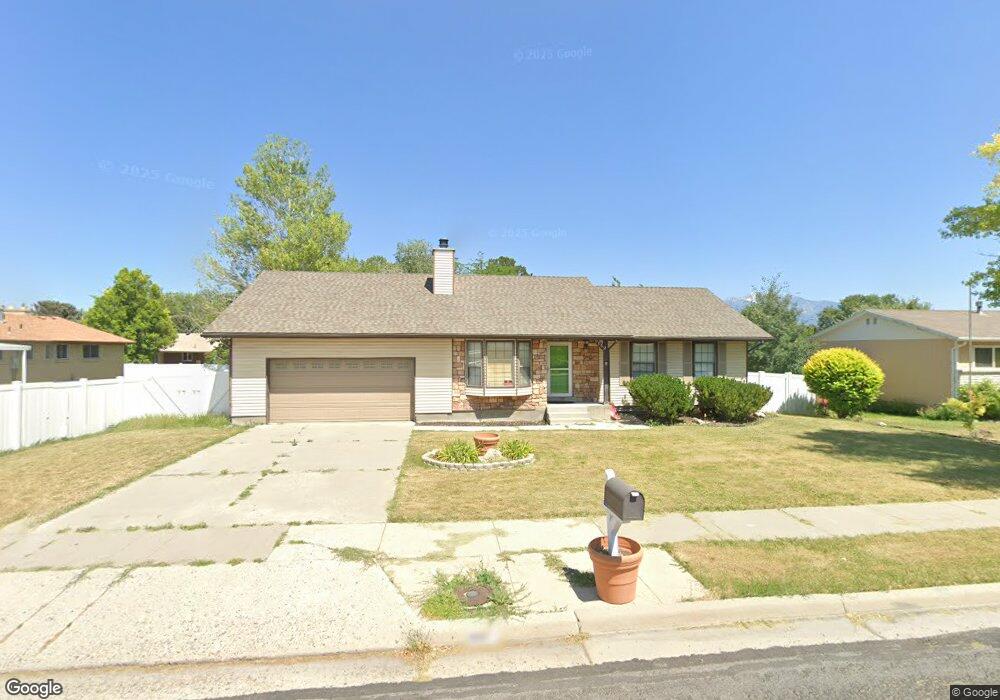
6849 S 2200 W West Jordan, UT 84084
Estimated Value: $489,000 - $543,000
5
Beds
1
Bath
2,356
Sq Ft
$221/Sq Ft
Est. Value
About This Home
Property Id: 899067
This spacious rambler has new carpets and paint throughout! Enjoy the updated kitchen, large yards, and 2-car garage with extra depth. Near Jordan Landing shopping area, Jordan River Parkway, and the Jordan Salt Lake City Canal trail. You will love to call this property home.
Ownership History
Date
Name
Owned For
Owner Type
Purchase Details
Closed on
Jul 14, 2014
Sold by
Dalley Branden
Bought by
Avila William D and Avila Angela C
Current Estimated Value
Home Financials for this Owner
Home Financials are based on the most recent Mortgage that was taken out on this home.
Original Mortgage
$124,000
Outstanding Balance
$94,131
Interest Rate
4.07%
Mortgage Type
New Conventional
Estimated Equity
$426,885
Purchase Details
Closed on
Mar 7, 2006
Sold by
Guida Linda D and Guida Christopher F
Bought by
Dalley Branden
Purchase Details
Closed on
Dec 20, 1996
Sold by
Guida Linda D
Bought by
Guida Christopher F
Home Financials for this Owner
Home Financials are based on the most recent Mortgage that was taken out on this home.
Original Mortgage
$109,600
Interest Rate
7.59%
Create a Home Valuation Report for This Property
The Home Valuation Report is an in-depth analysis detailing your home's value as well as a comparison with similar homes in the area
Home Values in the Area
Average Home Value in this Area
Purchase History
| Date | Buyer | Sale Price | Title Company |
|---|---|---|---|
| Avila William D | -- | Meridian Title | |
| Dalley Branden | $162,000 | None Available | |
| Guida Christopher F | -- | -- |
Source: Public Records
Mortgage History
| Date | Status | Borrower | Loan Amount |
|---|---|---|---|
| Open | Avila William D | $124,000 | |
| Previous Owner | Guida Christopher F | $109,600 |
Source: Public Records
Property History
| Date | Event | Price | List to Sale | Price per Sq Ft |
|---|---|---|---|---|
| 09/10/2025 09/10/25 | Off Market | $2,900 | -- | -- |
| 06/17/2025 06/17/25 | For Rent | $2,900 | 0.0% | -- |
| 06/14/2025 06/14/25 | Off Market | $2,900 | -- | -- |
| 06/01/2025 06/01/25 | Price Changed | $2,900 | -3.3% | $1 / Sq Ft |
| 04/09/2025 04/09/25 | For Rent | $3,000 | -- | -- |
Tax History Compared to Growth
Tax History
| Year | Tax Paid | Tax Assessment Tax Assessment Total Assessment is a certain percentage of the fair market value that is determined by local assessors to be the total taxable value of land and additions on the property. | Land | Improvement |
|---|---|---|---|---|
| 2025 | $2,443 | $492,000 | $120,200 | $371,800 |
| 2024 | $2,443 | $470,100 | $113,400 | $356,700 |
| 2023 | $2,443 | $446,700 | $105,000 | $341,700 |
| 2022 | $2,520 | $449,600 | $102,900 | $346,700 |
| 2021 | $2,097 | $340,500 | $80,500 | $260,000 |
| 2020 | $1,913 | $291,500 | $80,500 | $211,000 |
| 2019 | $1,874 | $280,000 | $80,500 | $199,500 |
| 2018 | $1,678 | $248,800 | $77,900 | $170,900 |
| 2017 | $1,565 | $231,000 | $77,900 | $153,100 |
| 2016 | $1,553 | $215,300 | $82,000 | $133,300 |
| 2015 | $1,581 | $213,800 | $87,400 | $126,400 |
| 2014 | $1,518 | $202,000 | $83,500 | $118,500 |
Source: Public Records
Map
Nearby Homes
- 6924 S 2160 W
- 6925 S Lexington Dr
- 2421 W 6900 S
- 6683 Alice Susanna Ln
- 2312 W Hidden Bend Cove Unit 107
- 1951 W 7125 S
- 7150 Camelot Way
- 6918 S Harvest Cir
- 7149 S Camelot Way
- 2333 W Ledgewood Dr
- 2683 W Carson Ln
- 2332 Broderick Dr
- 7279 S Kenadi Ct
- 2126 W Happiness Dr
- 1718 W Trey Way Unit 2
- 1607 W Beamon St
- 7118 S Equator Ln Unit 14 B
- 2091 W 6200 S
- 2045 W 6200 S
- 8524 S Michele River Ave W Unit 109
- 6859 S 2200 W
- 2189 W Lexington Dr
- 2189 Lexington Dr
- 6842 S 2160 W
- 6854 S 2160 W
- 6830 S 2160 W
- 6871 S 2200 W
- 3559 Lexington Dr
- 6872 S 2160 W
- 6864 S 2200 W
- 6824 S 2200 W
- 6852 S 2200 W
- 2188 Lexington Dr
- 2142 Concord Cir
- 6883 S 2200 W
- 6837 S 2160 W
- 6886 S 2160 W
- 6812 S 2200 W
- 6880 S 2200 W
- 2139 Concord Cir