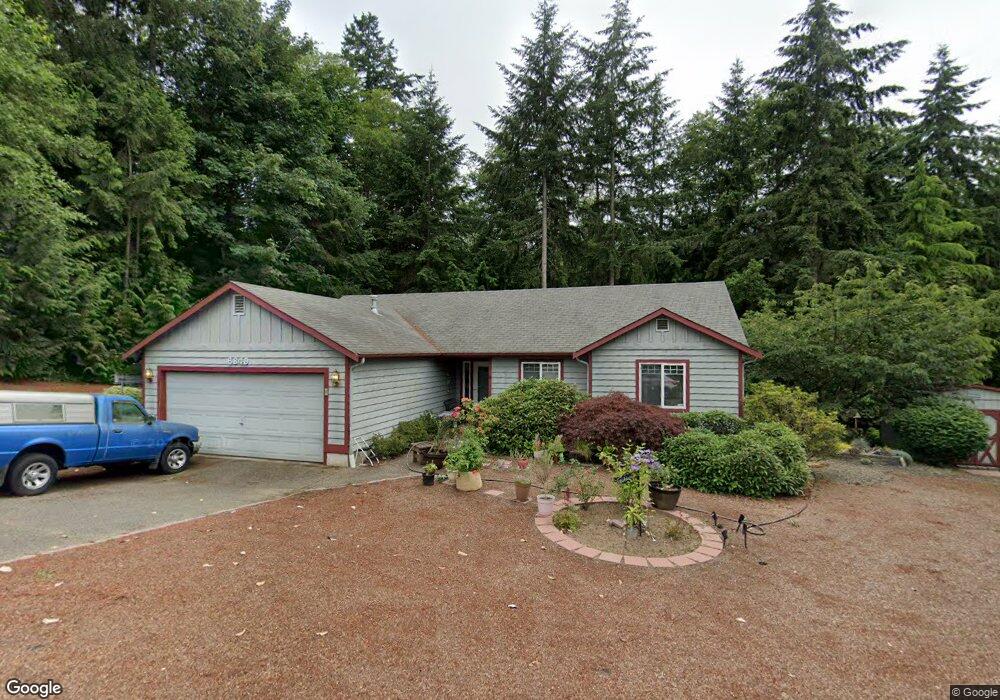
6849 Townsend Ln NE Bremerton, WA 98311
Estimated Value: $493,000 - $530,000
3
Beds
2
Baths
1,550
Sq Ft
$328/Sq Ft
Est. Value
About This Home
This home is located at 6849 Townsend Ln NE, Bremerton, WA 98311 and is currently estimated at $508,837, approximately $328 per square foot. 6849 Townsend Ln NE is a home located in Kitsap County with nearby schools including Esquire Hills Elementary School, Fairview Middle School, and Olympic High School.
Ownership History
Date
Name
Owned For
Owner Type
Purchase Details
Closed on
Aug 8, 2008
Sold by
Hatfield Joseph F
Bought by
Robinson Leverne P and Robinson William
Current Estimated Value
Home Financials for this Owner
Home Financials are based on the most recent Mortgage that was taken out on this home.
Original Mortgage
$290,442
Outstanding Balance
$190,063
Interest Rate
6.27%
Mortgage Type
FHA
Estimated Equity
$318,774
Purchase Details
Closed on
Nov 17, 2005
Sold by
Defevers Charles M and Defevers Dolores L
Bought by
Hatfield Joseph F and Hatfield Karen L
Home Financials for this Owner
Home Financials are based on the most recent Mortgage that was taken out on this home.
Original Mortgage
$278,910
Interest Rate
5.93%
Mortgage Type
VA
Purchase Details
Closed on
Jul 15, 1997
Sold by
Joe Gates Construction Inc
Bought by
Defevers Charles M and Defevers Dolores L
Home Financials for this Owner
Home Financials are based on the most recent Mortgage that was taken out on this home.
Original Mortgage
$121,500
Interest Rate
6%
Create a Home Valuation Report for This Property
The Home Valuation Report is an in-depth analysis detailing your home's value as well as a comparison with similar homes in the area
Home Values in the Area
Average Home Value in this Area
Purchase History
| Date | Buyer | Sale Price | Title Company |
|---|---|---|---|
| Robinson Leverne P | $295,280 | Pacific Nw Title | |
| Hatfield Joseph F | $270,280 | First American Title Ins | |
| Defevers Charles M | $135,000 | Charter Title Corp |
Source: Public Records
Mortgage History
| Date | Status | Borrower | Loan Amount |
|---|---|---|---|
| Open | Robinson Leverne P | $290,442 | |
| Previous Owner | Hatfield Joseph F | $278,910 | |
| Previous Owner | Defevers Charles M | $121,500 |
Source: Public Records
Tax History Compared to Growth
Tax History
| Year | Tax Paid | Tax Assessment Tax Assessment Total Assessment is a certain percentage of the fair market value that is determined by local assessors to be the total taxable value of land and additions on the property. | Land | Improvement |
|---|---|---|---|---|
| 2026 | $3,806 | $400,640 | $122,120 | $278,520 |
| 2025 | $3,806 | $400,640 | $122,120 | $278,520 |
| 2024 | $3,702 | $400,640 | $122,120 | $278,520 |
| 2023 | $3,714 | $400,640 | $122,120 | $278,520 |
| 2022 | $3,497 | $332,040 | $100,930 | $231,110 |
| 2021 | $3,557 | $321,920 | $75,150 | $246,770 |
| 2020 | $3,323 | $304,140 | $70,920 | $233,220 |
| 2019 | $3,098 | $274,210 | $64,040 | $210,170 |
| 2018 | $3,317 | $227,830 | $52,920 | $174,910 |
| 2017 | $2,947 | $227,830 | $52,920 | $174,910 |
| 2016 | $2,862 | $204,530 | $47,250 | $157,280 |
| 2015 | $2,631 | $195,930 | $55,100 | $140,830 |
| 2014 | -- | $187,510 | $55,100 | $132,410 |
| 2013 | -- | $187,510 | $55,100 | $132,410 |
Source: Public Records
Map
Nearby Homes
- 7020 Saint Charles Ln NE
- 2112 NE Lexington Dr
- 6522 State Hwy 303 NE
- 2348 NE Windsor Ct
- 1858 NE Mcwilliams Rd
- 7655 Forest Ridge Dr NE
- 7265 Thasos Ave NE
- 3924 McCormick Village Dr Unit 25
- 0 Kaster Dr NE
- 7726 Lazy s Ln NE
- 2940 Osiris Ct NE
- 3060 NE Mcwilliams Rd Unit 104
- 3060 NE Mcwilliams Rd Unit 9
- 3060 NE Mcwilliams Rd Unit 124
- 8065 Autumn Hills Place NE
- 7529 Bridge Place NE
- 7761 Beacon Place NE Unit 103
- 940 Yoder Ln NE
- 7545 Old Military Rd NE
- 7701 Beacon Place NE Unit B103
- 6855 Townsend Ln NE
- 6856 Townsend Ln NE
- 6850 Townsend Ln NE
- 1941 NE Bentley Dr
- 6862 Townsend Ln NE
- 1934 NE Bentley Dr
- 6809 Townsend Ln NE
- 6844 Townsend Ln NE
- 6825 Townsend Ln NE
- 1928 NE Bentley Dr
- 6838 Townsend Ln NE
- 6867 Townsend Ln NE
- 1929 NE Bentley Dr
- 1921 NE Bentley Dr
- 6819 Townsend Ln NE
- 6874 Townsend Ln NE
- 6832 Townsend Ln NE
- 1920 NE Bentley Dr
- 6798 Bentley Cir NE