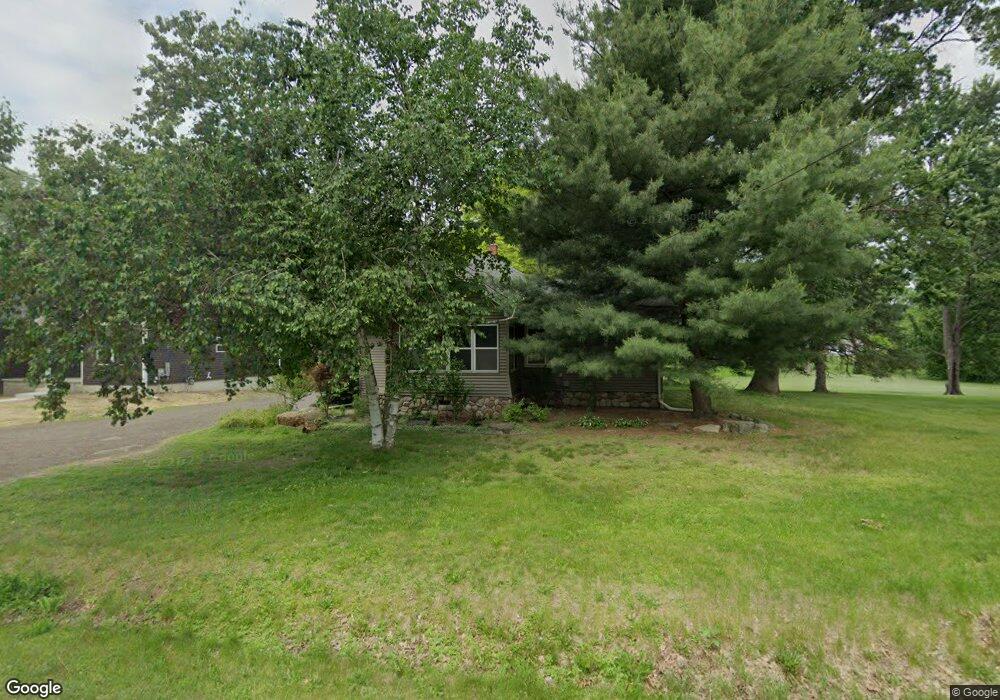
685 Crescent Lake Rd Waterford, MI 48327
Waterford Township NeighborhoodEstimated Value: $229,810 - $262,000
2
Beds
1
Bath
1,251
Sq Ft
$199/Sq Ft
Est. Value
About This Home
This home is located at 685 Crescent Lake Rd, Waterford, MI 48327 and is currently estimated at $249,453, approximately $199 per square foot. 685 Crescent Lake Rd is a home located in Oakland County with nearby schools including Riverside Elementary School, Pierce Middle School, and Waterford Mott High School.
Ownership History
Date
Name
Owned For
Owner Type
Purchase Details
Closed on
Sep 8, 2023
Sold by
Twin Pines Properties Llc
Bought by
Cummings James
Current Estimated Value
Home Financials for this Owner
Home Financials are based on the most recent Mortgage that was taken out on this home.
Original Mortgage
$162,011
Outstanding Balance
$158,536
Interest Rate
6.9%
Mortgage Type
FHA
Estimated Equity
$90,917
Purchase Details
Closed on
Oct 28, 2010
Sold by
Haner Tom
Bought by
Twin Pines Properties L L C
Purchase Details
Closed on
Jul 10, 2008
Sold by
Mortgage Electronic Registration Systems
Bought by
Countrywide Bank Fsb
Purchase Details
Closed on
Jun 3, 2008
Sold by
Bordinat Jeffrey B
Bought by
Mortgage Electronic Registration Systems
Purchase Details
Closed on
Mar 30, 2004
Sold by
Bordinat Deborah F
Bought by
Bordinat Jeffrey B
Purchase Details
Closed on
Apr 27, 2000
Sold by
Doyle Edward J
Bought by
Bordinat Jeffrey B
Create a Home Valuation Report for This Property
The Home Valuation Report is an in-depth analysis detailing your home's value as well as a comparison with similar homes in the area
Home Values in the Area
Average Home Value in this Area
Purchase History
| Date | Buyer | Sale Price | Title Company |
|---|---|---|---|
| Cummings James | $165,000 | Michigan Investment Title | |
| Cummings James | $165,000 | Michigan Investment Title | |
| Twin Pines Properties L L C | -- | Philip R Seaver Title Co Inc | |
| Countrywide Bank Fsb | -- | None Available | |
| Mortgage Electronic Registration Systems | $102,365 | None Available | |
| Bordinat Jeffrey B | -- | -- | |
| Bordinat Jeffrey B | $160,000 | -- |
Source: Public Records
Mortgage History
| Date | Status | Borrower | Loan Amount |
|---|---|---|---|
| Open | Cummings James | $162,011 | |
| Closed | Cummings James | $162,011 | |
| Closed | Bordinat Jeffrey B | -- |
Source: Public Records
Tax History Compared to Growth
Tax History
| Year | Tax Paid | Tax Assessment Tax Assessment Total Assessment is a certain percentage of the fair market value that is determined by local assessors to be the total taxable value of land and additions on the property. | Land | Improvement |
|---|---|---|---|---|
| 2024 | $4,265 | $108,410 | $0 | $0 |
| 2023 | $1,809 | $99,070 | $0 | $0 |
| 2022 | $2,584 | $91,560 | $0 | $0 |
| 2021 | $2,457 | $83,390 | $0 | $0 |
| 2020 | $1,668 | $78,340 | $0 | $0 |
| 2019 | $2,221 | $75,120 | $0 | $0 |
| 2018 | $2,192 | $58,530 | $0 | $0 |
| 2017 | $2,060 | $58,530 | $0 | $0 |
| 2016 | $2,051 | $49,270 | $0 | $0 |
| 2015 | -- | $42,170 | $0 | $0 |
| 2014 | -- | $38,560 | $0 | $0 |
| 2011 | -- | $44,770 | $0 | $0 |
Source: Public Records
Map
Nearby Homes
- 5184 Denwood St
- 571 Cristy Ave
- 867 Saybrook Dr
- 4840 Hobson Ave
- 001 Hobson Ave
- 4935 Pontiac Lake Rd
- 00 Gilbo Ave
- 261 Hershey Blvd
- 5251 Pontiac Lake Rd
- 4882 Elizabeth Lake Rd
- 4875 Fenmore Ave
- 241 Reymont Rd
- 5357 Farm Rd
- 4700 Siebert Rd
- 89 Clive Ave
- 5667 Brunswick Blvd
- 5510 Berkley Dr
- 5675 Pontiac Lake Rd
- 5531 Berkley Dr
- 1360 Nancywood Dr
- 711 Crescent Lake Rd
- 673 Crescent Lake Rd
- 676 Crescent Lake Rd
- 719 Crescent Lake Rd
- 651 Crescent Lake Rd
- 696 Crescent Lake Rd
- 686 Crescent Lake Rd
- 704 Crescent Lake Rd
- 664 Crescent Lake Rd
- 639 Crescent Lake Rd
- 654 Crescent Lake Rd Unit Bldg-Unit
- 654 Crescent Lake Rd
- 739 Crescent Lake Rd
- 716 Crescent Lake Rd
- 726 Crescent Lake Rd
- 627 Crescent Lake Rd
- 640 Crescent Lake Rd
- 751 Crescent Lake Rd
- 760 Crescent Lake Rd
- 628 Crescent Lake Rd