Estimated Value: $64,000 - $189,000
Studio
--
Bath
2,229
Sq Ft
$57/Sq Ft
Est. Value
About This Home
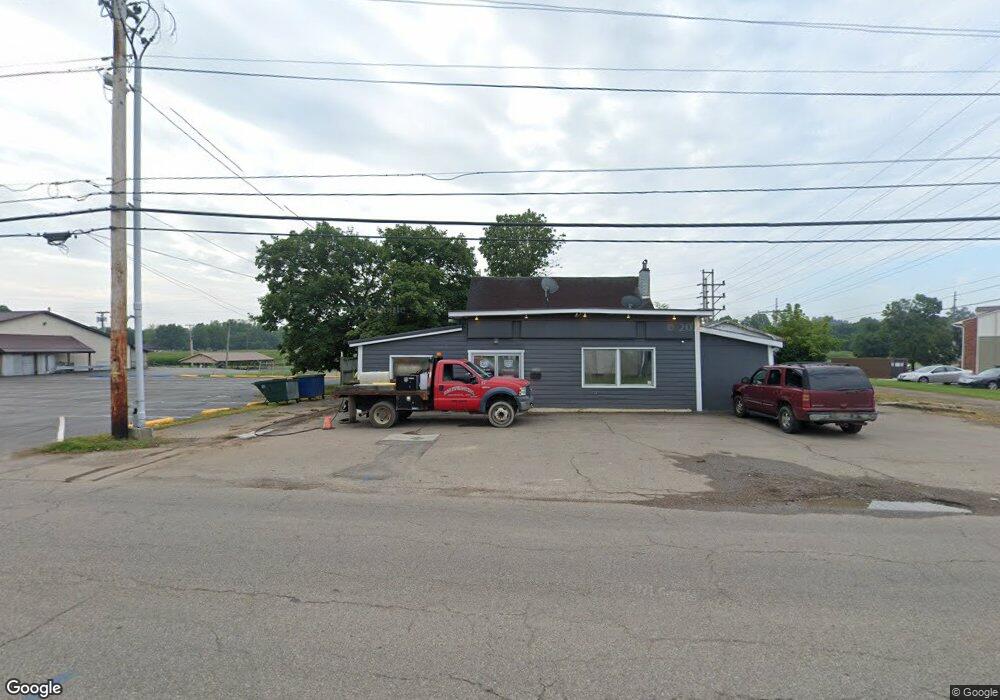
This home is located at 685 E Front St, Logan, OH 43138 and is currently estimated at $127,718, approximately $57 per square foot. 685 E Front St is a home located in Hocking County with nearby schools including Central Elementary School, St. John the Evangelist School, and Logan Christian School.
Ownership History
Date
Name
Owned For
Owner Type
Purchase Details
Closed on
Jul 29, 2024
Sold by
Theiss Realty Investments Llc
Bought by
Bowman Brock and Bowman Dale
Current Estimated Value
Purchase Details
Closed on
Jul 26, 2019
Sold by
Hanning Christopher
Bought by
Theiss Realty Investments Llc
Home Financials for this Owner
Home Financials are based on the most recent Mortgage that was taken out on this home.
Original Mortgage
$17,350
Interest Rate
3.7%
Mortgage Type
Land Contract Argmt. Of Sale
Purchase Details
Closed on
Dec 5, 2014
Sold by
Poling Julia
Bought by
Hanning Christopher J
Home Financials for this Owner
Home Financials are based on the most recent Mortgage that was taken out on this home.
Original Mortgage
$44,269
Interest Rate
3.97%
Mortgage Type
Purchase Money Mortgage
Purchase Details
Closed on
May 15, 2001
Bought by
Hanning Christopher J 6720 N Wri
Create a Home Valuation Report for This Property
The Home Valuation Report is an in-depth analysis detailing your home's value as well as a comparison with similar homes in the area
Home Values in the Area
Average Home Value in this Area
Purchase History
| Date | Buyer | Sale Price | Title Company |
|---|---|---|---|
| Bowman Brock | $53,000 | Secure Title Services Ltd | |
| Bowman Brock | $53,000 | Secure Title Services Ltd | |
| Theiss Realty Investments Llc | $53,000 | Secure Title | |
| Theiss Realty Investments Llc | $53,000 | Secure Title | |
| Theiss Realty Investments Llc | $53,000 | None Available | |
| Hanning Christopher J | $42,000 | None Available | |
| Hanning Christopher J 6720 N Wri | $42,000 | -- |
Source: Public Records
Mortgage History
| Date | Status | Borrower | Loan Amount |
|---|---|---|---|
| Previous Owner | Theiss Realty Investments Llc | $17,350 | |
| Previous Owner | Hanning Christopher J | $44,269 |
Source: Public Records
Tax History
| Year | Tax Paid | Tax Assessment Tax Assessment Total Assessment is a certain percentage of the fair market value that is determined by local assessors to be the total taxable value of land and additions on the property. | Land | Improvement |
|---|---|---|---|---|
| 2024 | $638 | $15,800 | $10,300 | $5,500 |
| 2023 | $638 | $15,800 | $10,300 | $5,500 |
| 2022 | $639 | $15,800 | $10,300 | $5,500 |
| 2021 | $590 | $13,530 | $8,130 | $5,400 |
| 2020 | $590 | $13,530 | $8,130 | $5,400 |
| 2019 | $590 | $13,530 | $8,130 | $5,400 |
| 2018 | $535 | $12,460 | $7,060 | $5,400 |
| 2017 | $504 | $12,460 | $7,060 | $5,400 |
| 2016 | $501 | $12,460 | $7,060 | $5,400 |
| 2015 | $1,140 | $15,750 | $10,840 | $4,910 |
| 2014 | $1,140 | $28,010 | $10,840 | $17,170 |
| 2013 | $1,145 | $28,010 | $10,840 | $17,170 |
Source: Public Records
Map
Nearby Homes
Your Personal Tour Guide
Ask me questions while you tour the home.