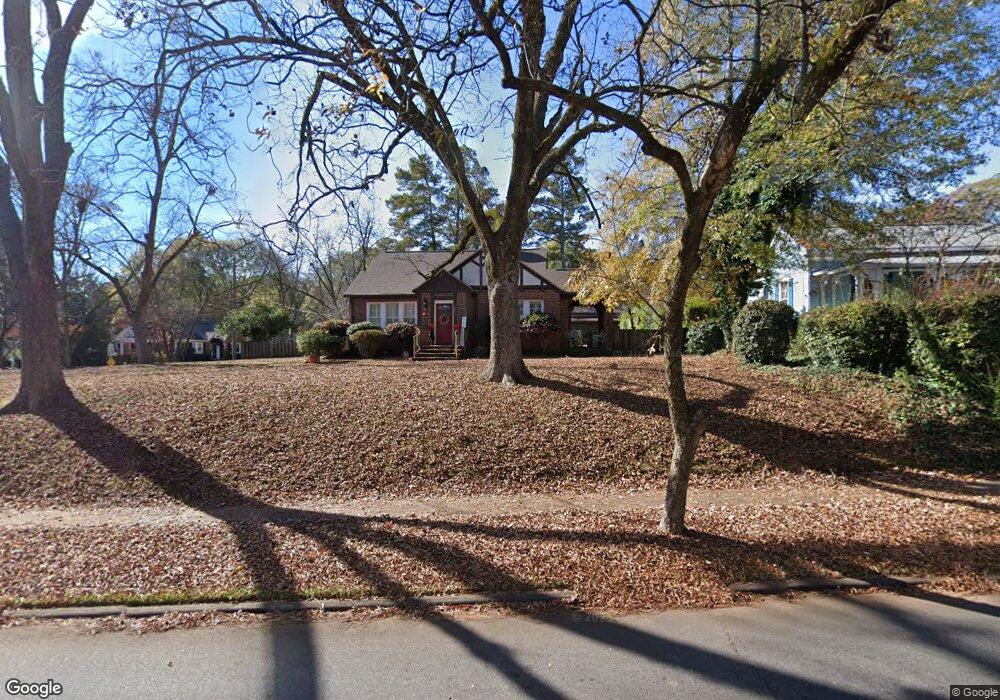
685 Maple Dr Griffin, GA 30224
Spalding County NeighborhoodEstimated Value: $284,037 - $310,000
3
Beds
3
Baths
2,024
Sq Ft
$145/Sq Ft
Est. Value
About This Home
This home is located at 685 Maple Dr, Griffin, GA 30224 and is currently estimated at $293,759, approximately $145 per square foot. 685 Maple Dr is a home located in Spalding County with nearby schools including Crescent Road Elementary School, Rehoboth Road Middle School, and Spalding High School.
Ownership History
Date
Name
Owned For
Owner Type
Purchase Details
Closed on
Jun 1, 2006
Sold by
Joiner John P and Joiner Julie B
Bought by
Barnes Anne J
Current Estimated Value
Home Financials for this Owner
Home Financials are based on the most recent Mortgage that was taken out on this home.
Original Mortgage
$34,300
Outstanding Balance
$27,174
Interest Rate
6.51%
Mortgage Type
Stand Alone Refi Refinance Of Original Loan
Estimated Equity
$266,585
Purchase Details
Closed on
Jul 26, 1999
Sold by
Joiner John P
Bought by
Joiner John P and Joiner Julie B
Home Financials for this Owner
Home Financials are based on the most recent Mortgage that was taken out on this home.
Original Mortgage
$96,500
Interest Rate
7.66%
Mortgage Type
New Conventional
Purchase Details
Closed on
Mar 17, 1997
Sold by
Hightower Jerry Eliz
Bought by
Joiner John P and Davis Julie B
Home Financials for this Owner
Home Financials are based on the most recent Mortgage that was taken out on this home.
Original Mortgage
$85,500
Interest Rate
7.98%
Mortgage Type
New Conventional
Purchase Details
Closed on
Jan 1, 1979
Sold by
Mashburn Hoke S
Bought by
Mashburn Elizabeth
Purchase Details
Closed on
Mar 7, 1957
Bought by
Mashburn Hoke S
Create a Home Valuation Report for This Property
The Home Valuation Report is an in-depth analysis detailing your home's value as well as a comparison with similar homes in the area
Home Values in the Area
Average Home Value in this Area
Purchase History
| Date | Buyer | Sale Price | Title Company |
|---|---|---|---|
| Barnes Anne J | $171,500 | -- | |
| Joiner John P | -- | -- | |
| Joiner John P | $95,000 | -- | |
| Mashburn Elizabeth | -- | -- | |
| Mashburn Hoke S | -- | -- |
Source: Public Records
Mortgage History
| Date | Status | Borrower | Loan Amount |
|---|---|---|---|
| Open | Barnes Anne J | $34,300 | |
| Previous Owner | Joiner John P | $96,500 | |
| Previous Owner | Joiner John P | $85,500 |
Source: Public Records
Tax History
| Year | Tax Paid | Tax Assessment Tax Assessment Total Assessment is a certain percentage of the fair market value that is determined by local assessors to be the total taxable value of land and additions on the property. | Land | Improvement |
|---|---|---|---|---|
| 2025 | $3,806 | $99,676 | $13,200 | $86,476 |
| 2024 | $3,723 | $99,676 | $13,200 | $86,476 |
| 2023 | $3,806 | $99,676 | $13,200 | $86,476 |
| 2022 | $3,418 | $85,538 | $12,000 | $73,538 |
| 2021 | $3,080 | $77,064 | $12,000 | $65,064 |
| 2020 | $3,080 | $77,064 | $12,000 | $65,064 |
| 2019 | $2,128 | $52,293 | $12,000 | $40,293 |
| 2018 | $2,091 | $49,508 | $12,000 | $37,508 |
| 2017 | $2,126 | $51,434 | $12,000 | $39,434 |
| 2016 | $1,977 | $47,077 | $12,000 | $35,077 |
| 2015 | $2,010 | $47,077 | $12,000 | $35,077 |
| 2014 | $1,966 | $47,077 | $12,000 | $35,077 |
Source: Public Records
Map
Nearby Homes
- 159 Milner Ave
- 711 Maple Dr
- 226 Tilney Ave
- 310 Terrace St
- 722 Maple Dr
- 816 Woodland Dr
- 411 Terrace St
- 824 Woodland Dr
- 550 S Hill St
- 517 S 6th St
- 729 Springer Dr
- 372 E College St
- 123 Huntsman Dr
- 1541 Zebulon Rd & Unit 4 TRACTS 35 ACRES
- 323 E College St
- 319 E College St
- 644 Brook Cir
- 505 Kincaid Ave
- 923 Mockingbird Ln
- 839 Bieze St
Your Personal Tour Guide
Ask me questions while you tour the home.