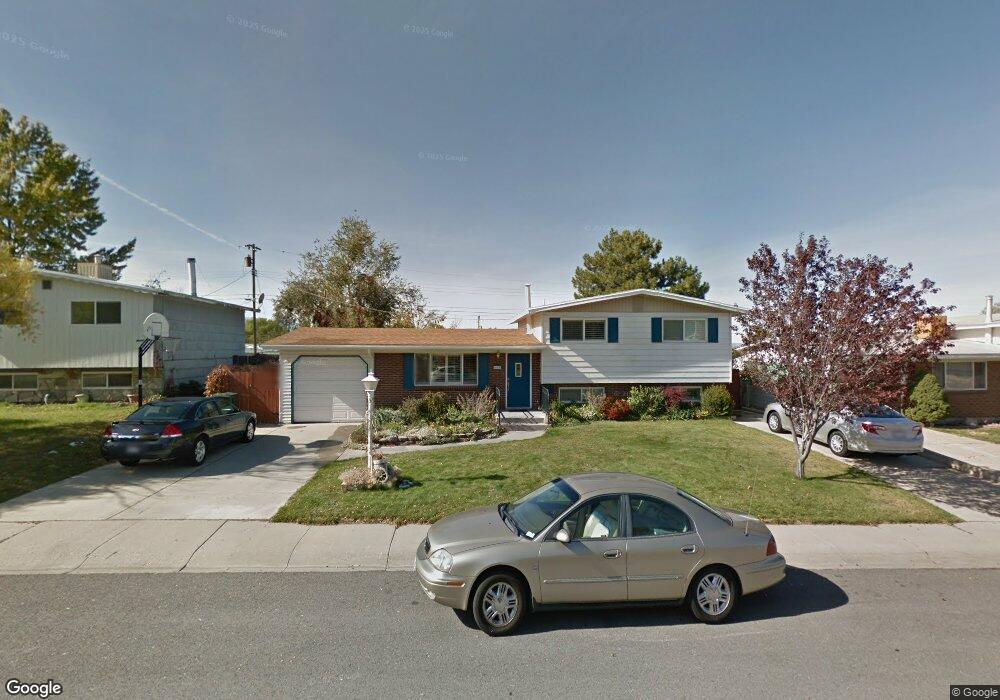
685 N Parkway Ave Tooele, UT 84074
Estimated Value: $352,000 - $380,000
--
Bed
--
Bath
1,705
Sq Ft
$211/Sq Ft
Est. Value
About This Home
This home is located at 685 N Parkway Ave, Tooele, UT 84074 and is currently estimated at $360,090, approximately $211 per square foot. 685 N Parkway Ave is a home located in Tooele County with nearby schools including Sterling Elementary School, Tooele Junior High School, and Tooele High School.
Ownership History
Date
Name
Owned For
Owner Type
Purchase Details
Closed on
Jul 16, 2021
Sold by
Matherne Joshua Perry and Matherne Alison Campo
Bought by
Matherne Joshua Perry and Matherne Alison Campo
Current Estimated Value
Home Financials for this Owner
Home Financials are based on the most recent Mortgage that was taken out on this home.
Original Mortgage
$227,500
Outstanding Balance
$206,610
Interest Rate
2.96%
Mortgage Type
New Conventional
Estimated Equity
$153,480
Purchase Details
Closed on
Apr 29, 2021
Sold by
Tillman Christopher P and Tillman Tania K
Bought by
Matherne Joshua Perry and Matherne Alison Campo
Home Financials for this Owner
Home Financials are based on the most recent Mortgage that was taken out on this home.
Original Mortgage
$220,000
Interest Rate
3%
Mortgage Type
Commercial
Purchase Details
Closed on
Feb 26, 2010
Sold by
Tillman Christopher P and Tillman Rania K
Bought by
Tillman Christoperh P and Tillman Rania K
Create a Home Valuation Report for This Property
The Home Valuation Report is an in-depth analysis detailing your home's value as well as a comparison with similar homes in the area
Home Values in the Area
Average Home Value in this Area
Purchase History
| Date | Buyer | Sale Price | Title Company |
|---|---|---|---|
| Matherne Joshua Perry | -- | Monument Title Insurance Inc | |
| Matherne Joshua Perry | -- | Monument Title Insurance Inc | |
| Tillman Christoperh P | -- | None Available |
Source: Public Records
Mortgage History
| Date | Status | Borrower | Loan Amount |
|---|---|---|---|
| Open | Matherne Joshua Perry | $227,500 | |
| Closed | Matherne Joshua Perry | $220,000 |
Source: Public Records
Tax History Compared to Growth
Tax History
| Year | Tax Paid | Tax Assessment Tax Assessment Total Assessment is a certain percentage of the fair market value that is determined by local assessors to be the total taxable value of land and additions on the property. | Land | Improvement |
|---|---|---|---|---|
| 2025 | $2,390 | $199,338 | $46,558 | $152,780 |
| 2024 | $2,546 | $194,372 | $46,558 | $147,814 |
| 2023 | $2,546 | $186,771 | $45,303 | $141,468 |
| 2022 | $2,043 | $175,770 | $55,110 | $120,660 |
| 2021 | $1,708 | $122,926 | $36,740 | $86,186 |
| 2020 | $1,562 | $195,014 | $38,313 | $156,701 |
| 2019 | $1,451 | $178,225 | $38,313 | $139,912 |
| 2018 | $1,389 | $161,663 | $40,000 | $121,663 |
| 2017 | $1,052 | $145,409 | $20,000 | $125,409 |
| 2016 | $859 | $70,978 | $11,000 | $59,978 |
| 2015 | $859 | $62,449 | $0 | $0 |
| 2014 | -- | $62,449 | $0 | $0 |
Source: Public Records
Map
Nearby Homes
- 122 E 730 N Unit 105
- 118 E 730 N Unit 104
- 151 E 730 N
- 79 E 600 N
- 698 Brook Ave E
- 590 N Brook Ave
- 252 E 715 N Unit 216
- 261 E 670 N Unit 220
- 298 E 600 N
- 465 N 100 E
- 294 E 600 N
- 635 Chimesview Cir
- 530 N 50 W
- 336 E 700 N
- 413 Parkway Ave
- 449 Marvista Ln
- 107 W 600 N Unit 204
- 367 E 740 N
- 395 N 1st St
- 516 N Broadway Ave
- 697 N Parkway Ave
- 698 N Parkway Ave
- 671 N Parkway Ave
- 672 N Parkway Ave
- 698 N 100 E
- 686 N 100 E
- 672 N 100 E
- 659 N Parkway Ave
- 660 N Parkway Ave
- 710 N 100 E
- 660 N 100 E
- 133 E 700 N
- 643 Parkway Ave E
- 685 Nelson Ave
- 643 N Parkway Ave
- 646 N Parkway Ave
- 671 Nelson Ave
- 646 N 100 E
- 157 E 700 N
- 659 Nelson Ave