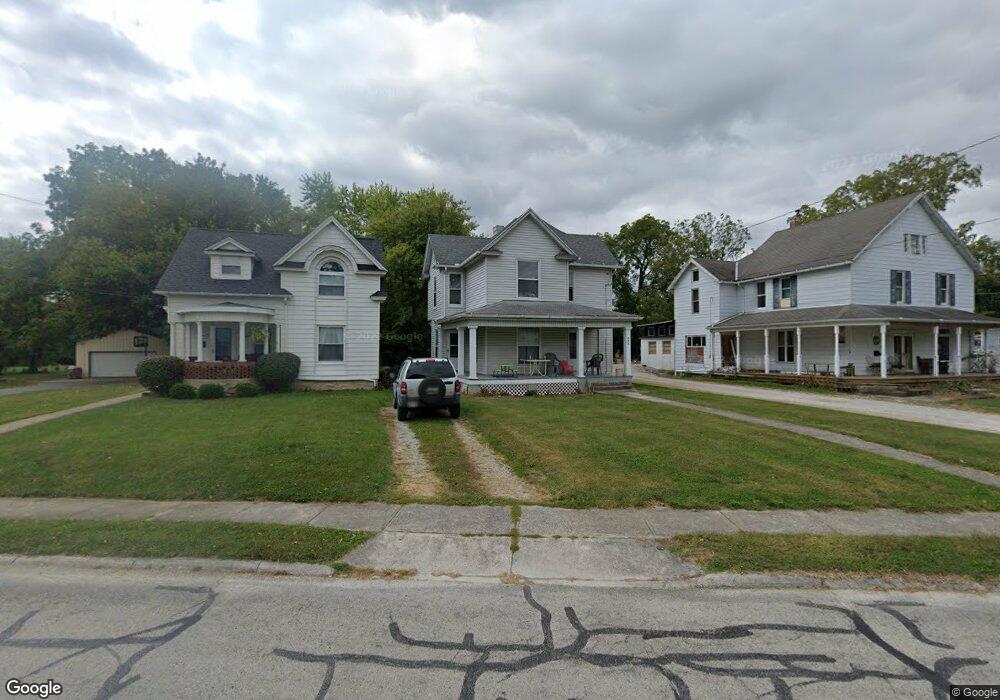
685 N Spring St Wilmington, OH 45177
Estimated Value: $161,000 - $232,000
3
Beds
2
Baths
1,568
Sq Ft
$125/Sq Ft
Est. Value
About This Home
This home is located at 685 N Spring St, Wilmington, OH 45177 and is currently estimated at $196,129, approximately $125 per square foot. 685 N Spring St is a home located in Clinton County with nearby schools including East End Elementary School, Denver Place Elementary School, and Roy E. Holmes Elementary School.
Ownership History
Date
Name
Owned For
Owner Type
Purchase Details
Closed on
Oct 3, 2025
Sold by
Brausch Thomas E and Brausch Tina R
Bought by
Brausch Group Llc
Current Estimated Value
Home Financials for this Owner
Home Financials are based on the most recent Mortgage that was taken out on this home.
Original Mortgage
$166,000
Outstanding Balance
$166,000
Interest Rate
6.58%
Mortgage Type
New Conventional
Estimated Equity
$30,129
Purchase Details
Closed on
Dec 28, 2022
Sold by
Brausch Iii Thomas E & Bethany R
Bought by
Brausch Group Llc
Purchase Details
Closed on
Aug 13, 2021
Sold by
Carnahan Brenda and Drummond Linda
Bought by
Brausch Thomas E and Brausch Bathany R
Home Financials for this Owner
Home Financials are based on the most recent Mortgage that was taken out on this home.
Original Mortgage
$52,500
Interest Rate
2.9%
Mortgage Type
New Conventional
Purchase Details
Closed on
May 8, 2018
Bought by
Carnahan Brenda Drummond B
Purchase Details
Closed on
Jan 1, 1990
Bought by
Drummond Dwight
Create a Home Valuation Report for This Property
The Home Valuation Report is an in-depth analysis detailing your home's value as well as a comparison with similar homes in the area
Home Values in the Area
Average Home Value in this Area
Purchase History
| Date | Buyer | Sale Price | Title Company |
|---|---|---|---|
| Brausch Group Llc | -- | None Listed On Document | |
| Brausch Group Llc | $166 | -- | |
| Brausch Thomas E | -- | Trico Title | |
| Bausch Thomas E | $70,000 | None Available | |
| Carnahan Brenda Drummond B | -- | -- | |
| Drummond Dwight | -- | -- |
Source: Public Records
Mortgage History
| Date | Status | Borrower | Loan Amount |
|---|---|---|---|
| Open | Brausch Group Llc | $166,000 | |
| Previous Owner | Bausch Thomas E | $52,500 |
Source: Public Records
Tax History Compared to Growth
Tax History
| Year | Tax Paid | Tax Assessment Tax Assessment Total Assessment is a certain percentage of the fair market value that is determined by local assessors to be the total taxable value of land and additions on the property. | Land | Improvement |
|---|---|---|---|---|
| 2024 | $1,695 | $49,180 | $7,140 | $42,040 |
| 2023 | $1,695 | $49,180 | $7,140 | $42,040 |
| 2022 | $1,207 | $32,970 | $6,460 | $26,510 |
| 2021 | $889 | $33,170 | $6,660 | $26,510 |
| 2020 | $835 | $33,170 | $6,660 | $26,510 |
| 2019 | $661 | $26,380 | $7,280 | $19,100 |
| 2018 | $668 | $26,380 | $7,280 | $19,100 |
| 2017 | $324 | $26,380 | $7,280 | $19,100 |
| 2016 | $595 | $24,730 | $6,560 | $18,170 |
| 2015 | $580 | $24,730 | $6,560 | $18,170 |
| 2013 | $620 | $25,640 | $6,560 | $19,080 |
Source: Public Records
Map
Nearby Homes