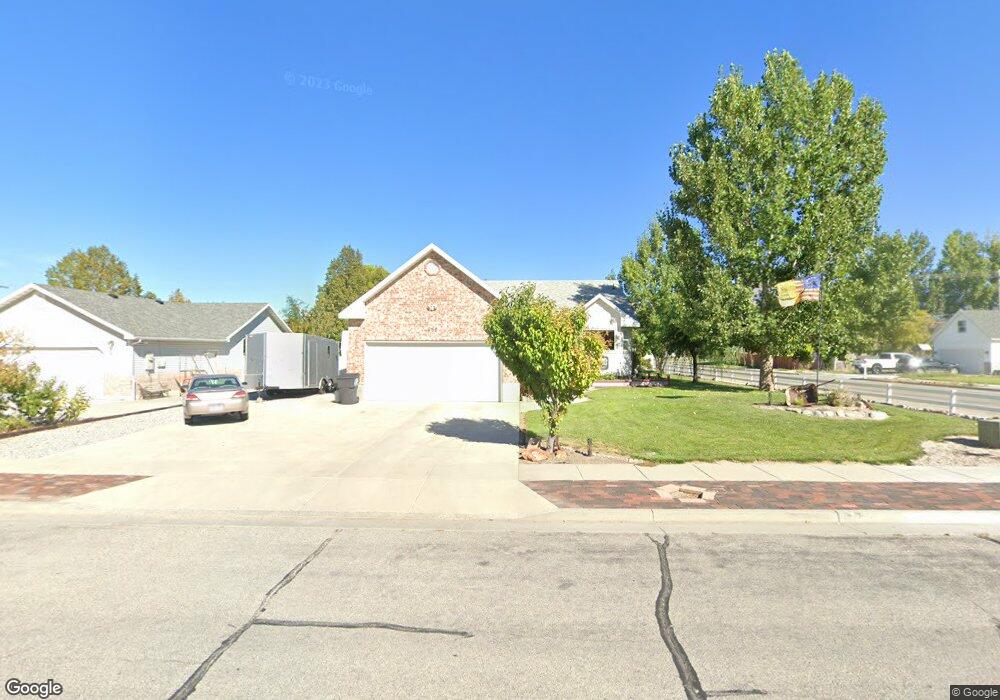
685 S 100 W Garland, UT 84312
Estimated Value: $517,000 - $547,000
5
Beds
3
Baths
3,567
Sq Ft
$150/Sq Ft
Est. Value
About This Home
This home is located at 685 S 100 W, Garland, UT 84312 and is currently estimated at $533,986, approximately $149 per square foot. 685 S 100 W is a home located in Box Elder County with nearby schools including Garland School, Bear River Middle School, and Alice C. Harris Intermediate School.
Ownership History
Date
Name
Owned For
Owner Type
Purchase Details
Closed on
Dec 11, 2017
Sold by
Buttars James Ad
Bought by
Buttars James A
Current Estimated Value
Home Financials for this Owner
Home Financials are based on the most recent Mortgage that was taken out on this home.
Original Mortgage
$233,516
Outstanding Balance
$195,626
Interest Rate
3.75%
Mortgage Type
FHA
Estimated Equity
$338,360
Purchase Details
Closed on
Feb 7, 2012
Sold by
Christensen Annette R and Christensen Richard G
Bought by
Buttars James A D
Home Financials for this Owner
Home Financials are based on the most recent Mortgage that was taken out on this home.
Original Mortgage
$188,775
Interest Rate
3.9%
Mortgage Type
New Conventional
Purchase Details
Closed on
Dec 18, 2009
Sold by
Kirkland Investment Inc
Bought by
Kirkland Investment Inc
Create a Home Valuation Report for This Property
The Home Valuation Report is an in-depth analysis detailing your home's value as well as a comparison with similar homes in the area
Home Values in the Area
Average Home Value in this Area
Purchase History
| Date | Buyer | Sale Price | Title Company |
|---|---|---|---|
| Buttars James A | -- | Northern Title Company | |
| Buttars James A D | -- | American Secure Title Brigh | |
| Kirkland Investment Inc | -- | -- |
Source: Public Records
Mortgage History
| Date | Status | Borrower | Loan Amount |
|---|---|---|---|
| Open | Buttars James A | $233,516 | |
| Closed | Buttars James A D | $188,775 |
Source: Public Records
Tax History Compared to Growth
Tax History
| Year | Tax Paid | Tax Assessment Tax Assessment Total Assessment is a certain percentage of the fair market value that is determined by local assessors to be the total taxable value of land and additions on the property. | Land | Improvement |
|---|---|---|---|---|
| 2025 | $3,488 | $531,983 | $110,000 | $421,983 |
| 2024 | $3,089 | $530,330 | $105,000 | $425,330 |
| 2023 | $3,048 | $516,198 | $100,000 | $416,198 |
| 2022 | $3,002 | $476,753 | $35,000 | $441,753 |
| 2021 | $2,498 | $329,640 | $35,000 | $294,640 |
| 2020 | $2,371 | $329,640 | $35,000 | $294,640 |
| 2019 | $2,207 | $162,659 | $19,250 | $143,409 |
| 2018 | $1,831 | $126,105 | $19,250 | $106,855 |
| 2017 | $1,900 | $229,281 | $19,250 | $194,281 |
| 2016 | $1,794 | $121,017 | $19,250 | $101,767 |
| 2015 | $1,664 | $111,765 | $19,250 | $92,515 |
| 2014 | $1,664 | $107,359 | $19,250 | $88,109 |
| 2013 | -- | $107,360 | $13,338 | $94,022 |
Source: Public Records
Map
Nearby Homes