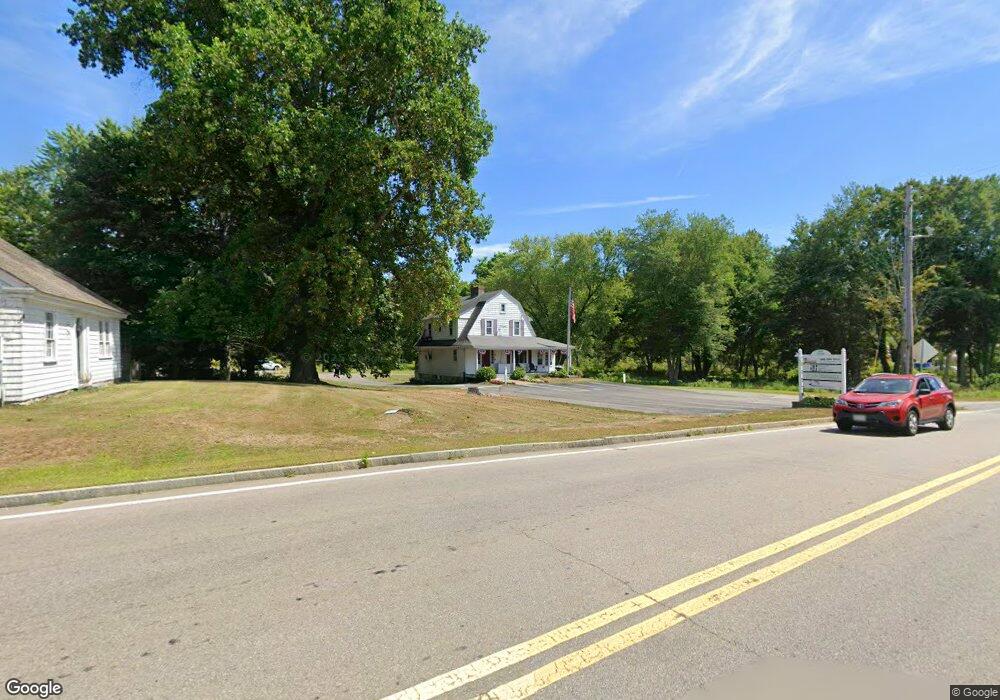
685 South St Wrentham, MA 02093
Estimated Value: $478,625
1
Bed
1
Bath
1,784
Sq Ft
$268/Sq Ft
Est. Value
About This Home
This home is located at 685 South St, Wrentham, MA 02093 and is currently estimated at $478,625, approximately $268 per square foot. 685 South St is a home located in Norfolk County with nearby schools including Delaney Elementary School and Charles E Roderick.
Ownership History
Date
Name
Owned For
Owner Type
Purchase Details
Closed on
Nov 19, 2021
Sold by
685 South Street Rt and Capone
Bought by
Mckennan Llc
Current Estimated Value
Home Financials for this Owner
Home Financials are based on the most recent Mortgage that was taken out on this home.
Original Mortgage
$320,000
Outstanding Balance
$293,225
Interest Rate
2.99%
Mortgage Type
Commercial
Estimated Equity
$185,400
Purchase Details
Closed on
Jun 1, 2007
Sold by
Wrenthm Post 9658 Vfw
Bought by
685 South Street Rt and Capone
Purchase Details
Closed on
Dec 23, 1993
Sold by
Benjamin Franklin Sb
Bought by
Wrentham Post 96
Purchase Details
Closed on
Sep 2, 1993
Sold by
Land Inc Est
Bought by
Benjamin Franklin Sb
Purchase Details
Closed on
Feb 5, 1991
Sold by
Carpenter Jane S
Bought by
Nuissl Tr Carl W
Create a Home Valuation Report for This Property
The Home Valuation Report is an in-depth analysis detailing your home's value as well as a comparison with similar homes in the area
Home Values in the Area
Average Home Value in this Area
Purchase History
| Date | Buyer | Sale Price | Title Company |
|---|---|---|---|
| Mckennan Llc | $395,000 | None Available | |
| Mckennan Llc | $395,000 | None Available | |
| 685 South Street Rt | $365,000 | -- | |
| 685 South Street Rt | $365,000 | -- | |
| Wrentham Post 96 | $125,000 | -- | |
| Wrentham Post 96 | $125,000 | -- | |
| Benjamin Franklin Sb | $130,000 | -- | |
| Benjamin Franklin Sb | $130,000 | -- | |
| Nuissl Tr Carl W | $1,000 | -- | |
| Nuissl Tr Carl W | $1,000 | -- |
Source: Public Records
Mortgage History
| Date | Status | Borrower | Loan Amount |
|---|---|---|---|
| Open | Mckennan Llc | $320,000 | |
| Closed | Mckennan Llc | $320,000 |
Source: Public Records
Tax History Compared to Growth
Tax History
| Year | Tax Paid | Tax Assessment Tax Assessment Total Assessment is a certain percentage of the fair market value that is determined by local assessors to be the total taxable value of land and additions on the property. | Land | Improvement |
|---|---|---|---|---|
| 2025 | -- | $375,100 | $188,000 | $187,100 |
| 2024 | -- | $375,100 | $188,000 | $187,100 |
| 2023 | $0 | $375,100 | $188,000 | $187,100 |
| 2022 | $0 | $346,700 | $188,000 | $158,700 |
| 2021 | $0 | $718,100 | $190,700 | $527,400 |
| 2020 | $5,527 | $353,100 | $140,100 | $213,000 |
| 2019 | $0 | $350,100 | $140,100 | $210,000 |
| 2018 | $0 | $345,700 | $127,400 | $218,300 |
| 2017 | $0 | $338,000 | $124,900 | $213,100 |
| 2016 | -- | $334,200 | $122,300 | $211,900 |
| 2015 | -- | $325,000 | $118,700 | $206,300 |
| 2014 | -- | $321,500 | $116,300 | $205,200 |
Source: Public Records
Map
Nearby Homes
- 791 South St Unit 5
- Lot 1 - Blueberry 2 Car Plan at King Philip Estates
- Lot 8 - Blueberry 2 Car Plan at King Philip Estates
- Lot 5 - Hughes 2 car Plan at King Philip Estates
- Lot 6 - Blueberry 3 Car Plan at King Philip Estates
- Lot 2 - Camden 2 Car Plan at King Philip Estates
- Lot 7 - Cedar Plan at King Philip Estates
- Lot 4 - Hemingway 2 Car Plan at King Philip Estates
- Lot 3 - Blueberry 2 Car Plan at King Philip Estates
- Lot 3 - 14 Earle Stewart Ln
- 11 Earle Stewart Ln
- 131 Creek St Unit 7
- 319 Taunton St
- 1204 South St
- 1222 South St
- 50 Green St
- 440 Chestnut St
- 10 Nature View Dr
- 15 Nature View Dr
- 80 Carriage House Ln
- 685 South St Unit L
- 685 South St Unit E
- 685 South St Unit 2
- 685 South St Unit G
- 685 South St Unit A
- 685 South St Unit F or G
- 685 South St Unit F
- 685 South St Unit B
- 667 South St
- 667 South St Unit 1
- 686 South St Unit 3
- 686 South St Unit 6A
- 686 South St Unit 9
- 686 South St Unit 4
- 686 South St Unit R
- 686 South St Unit 2
- 686 South St Unit 6
- 674 South St
- 715 South St
- 708 South St